Figures & data
Figure 1. A characteristic AFM force-distance curve on a fluid bilayer. The unique profile can be used to verify the presence of a bilayer when imaging a featureless single lipid phase. As the AFM tip approaches (black solid curve) it first interacts with the bilayer approximately 6.5 nm from the mica surface. The bilayer then compresses beneath the tip to a thickness of 3 nm at a force of 2 nN before the tip breaks through to the mica substrate. As the force is reduced (grey dashed curve) the tip stays in contact with the mica until the force is ∼0 nN at which point the bilayer suddenly reforms beneath the tip pushing it out (unpublished observations: S. D. Connell & D. A. Smith).
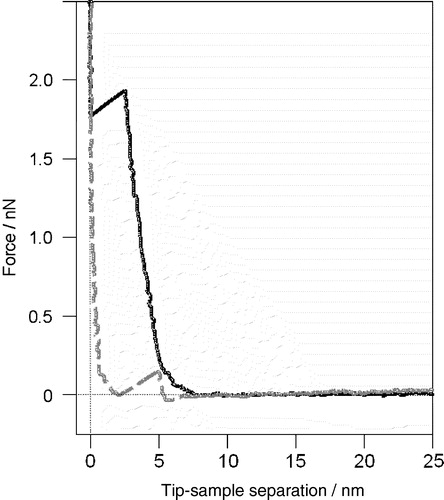
Figure 2. Tapping mode AFM images of equimolar sphingomyelin/DOPC bilayers under fluid. The SM enriched domains are in the gel phase characterized by the rough edges to the domains which are higher in the image than the surrounding fluid DOPC rich phase. Gel phase sphingomyelin can take on a wide variety of structures under apparently the same experimental conditions. In this case each domain is very large, up to many microns across, but on closer inspection many smaller domains can be seen to make up this structure (unpublished observations: S. D. Connell & D. A. Smith). This figure is reproduced in colour in Molecular Membrane Biology online.
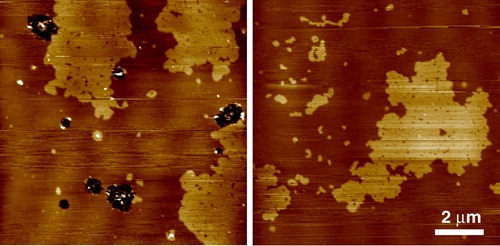
Figure 3. Phase separation in single bilayers supported on mica imaged by tapping mode AFM under buffer at 23°C. All scans are 5 µm with a 5 nm z-range. (A) SM:DOPC 1:3 – domains of so phase SM surrounded by ld phase of mainly DOPC. Gel domains are small and fragmented with highly convoluted perimeters. (B) SM:DOPC 1:1 + 10 mol% cholesterol – domains still retain characteristics of the gel phase although they have now coalesced to form fewer larger domains. (C) SM:DOPC 1:1 + 33 mol% cholesterol – the domains are now in the lo phase and line tension and increased fluidity has smoothed the domain perimeters. Note the relative difference in height between the ld phase and the other domains progressively reduces as the cholesterol concentration increases from 1.4 nm in the case of so/ld, to 0.7 nm for the lo/ld system (unpublished observations: S. D. Connell & D. A. Smith). This figure is reproduced in colour in Molecular Membrane Biology online.
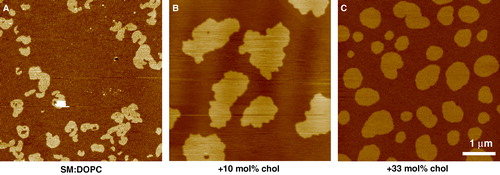
Figure 4. Tapping mode AFM images taken under fluid of the effect of detergent on lipid bilayers of the canonical raft composition – equimolar DOPC, SM and cholesterol. (A) Phase separation of the ld and lo domains prior to detergent treatment. This composition appears to be close to a critical point, with a characteristic finger-like structure to the condensed domains. z-range = 5 nm. (B) Upon treatment with Triton X-100 for 10 minutes (at 0.06% just above its cmc), the ld phase is completely removed exposing the mica substrate but leaving behind detergent resistant domains that correspond closely to the lo phase. z-range = 12 nm (unpublished observations: S. D. Connell & D. A. Smith). This figure is reproduced in colour in Molecular Membrane Biology online.
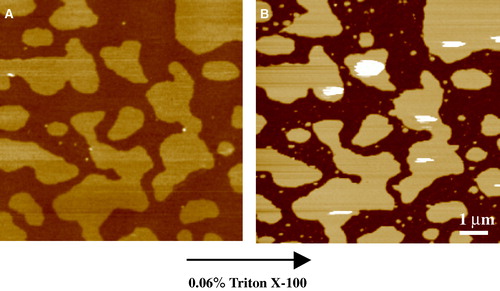
Figure 5. Tapping mode AFM image taken under fluid of multiple bilayers of 1:1:1 DOPC:SM:chol on mica highlighting the influence of the substrate on the thickness of the first bilayer. Note that there is no phase separation in this case because at the temperature of the experiment the system is in a single lo phase. Thicknesses of bilayers, shown on the right, range from 5.2±0.1 nm adjacent to the mica, to 6.2±0.1 nm, 6.3±0.1 nm, and 6.4±0.1 nm for the subsequent bilayers (unpublished observations: S. D. Connell & D. A. Smith). This figure is reproduced in colour in Molecular Membrane Biology online.
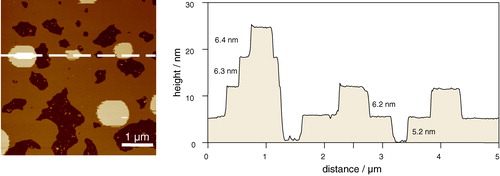
Figure 6. Tapping mode AFM images of a single bilayer formed by vesicle fusion on mica showing phase separation in a DMPC/DSPC 1:1 mixture. The temperature (31°C) is above the Tm for DMPC and below the Tm for DSPC. Proximity to the mica substrate does not prevent lipid mobility – small ld domains gradually flow and coalesce into large irregular domains, which are then pulled into a perfectly round shape to minimize line tension (unpublished observations: G. Li, S. D. Connell & D. A. Smith).
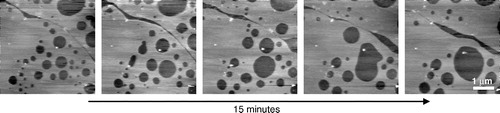
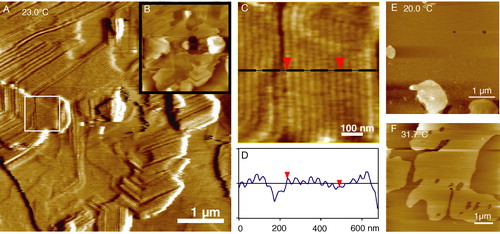
Figure 7. Tapping mode AFM images of multiple bilayers of 1:1 DMPC:DSPC showing the pre-transition or ‘ripple’ phase. The sample was incubated for 20 h at 23.0°C just below the main melting transition of DMPC (Tm = 23.7°C). (A) A friction (lateral force) image showing the morphology of the ripple phase including 120° bends due to the underlying hexagonal symmetry. Inset (B) is a height image of the same area to highlight the multilayer coverage. (C) A detail of the fine ripples from the region indicated by the white box in image A. (D) A line section through the ripples which have a wavelength of 34 nm and height of ∼1.0 nm. (E) Below the pre-transition temperature the uppermost bilayer is flat with both components in the gel phase. Bilayer thicknesses are 5.6 nm measured against the underlying mica at defects or from step edges on multiple bilayer patches. In (F) the temperature has been increased to 31.7°C above the main transition of DMPC but still below that of DSPC (Tm = 58.2°C) hence phase separation is observed (unpublished observations: G. Li, S. D. Connell & D. A. Smith). This figure is reproduced in colour in Molecular Membrane Biology online.