Figures & data
Figure 1. Distribution of raft markers in human erythrocyte membrane exvaginations (spiculae). Scanning electron micrograph showing exvaginated human erythrocytes following incubation with ionophore A23187 (1 µM, 10 min, 37°C) in the presence of 3.8 mM calcium (A). Immunocytochemical detection of stomatin in erythrocytes treated with A23187 plus calcium (B1), dodecylmaltoside (B2), dodecylzwittergent (B3) and untreated (B4). Immunocytochemical detection of sorcin in erythrocytes treated with A23187 plus calcium (C1), dodecylmaltoside (C3, in inset permeable cells) and untreated (C4). C2 is a transmission light micrograph showing the mainly sphero-echinocytic shape of erythrocytes shown in C1. Immunocytochemical detection of synexin in erythrocytes treated with A23187 plus calcium (D1), dodecylmaltoside (D2) and untreated (D3). Detection of ganglioside GM1 by cholera toxin subunit B staining of erythrocytes treated with ionophore A23187 plus calcium (E1), dodecylzwittergent (E2) and dodecylmaltoside (E3). Notably, the magnification is larger in A than in other micrographs. This Figure is reproduced in colour in Molecular Membrane Biology online.
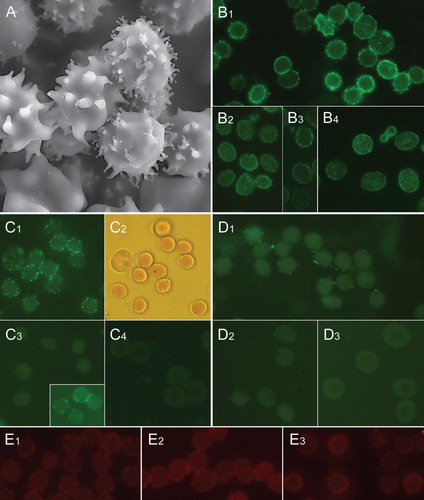
Figure 2. Distribution of raft markers in human erythrocyte membrane invaginations. Transmission electron micrograph showing invaginated human erythrocytes following incubation with chlorpromazine (100 µM, 60 min, 37°C) (A). Clustered endovesicle-like invaginations are seen. Cholera toxin subunit B staining of gangliosides in erythrocytes treated with chlorpromazine (B1) and untreated cells (B2). Ganglioside GM1-BODIPY staining of erythrocytes treated with chlorpromazine (C1), Triton X-100 (C2) and untreated cells (C3). Immunocytochemical detection of flotillin-1 in erythrocytes treated with chlorpromazine (D1) and untreated cells (D2). Immunocytochemical detection of stomatin in erythrocytes treated with chlorpromazine (E1) and untreated cells (E2). Notably, the magnification is larger in A than in other micrographs. This Figure is reproduced in colour in Molecular Membrane Biology online.
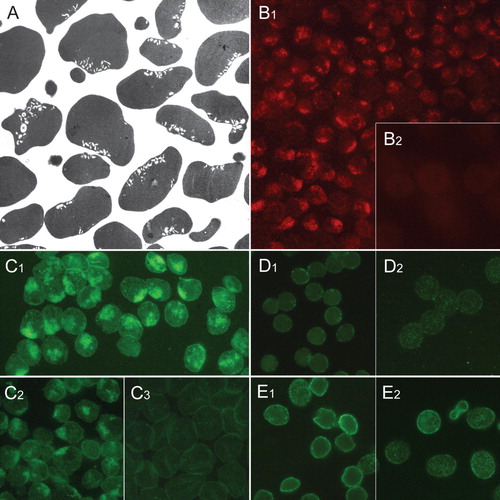
Figure 3. Different membrane protein composition of ghosts compared to M-, Z- and C-vesicles. Erythrocytes were treated with dodecylmaltoside, dodecylzwittergent, or calcium/A23187, and the vesicles were prepared as described in the text. C-vesicles (C), M-vesicles (M), Z-vesicles (Z) and erythrocyte membranes (Gh) were analysed for AChE activity. Aliquots of the vesicles (normalized to AChE activity) and of the erythrocyte membranes (containing one third of the vesicular AChE activity (lowest panel in arbitrary units)) were analysed by 11% polyacrylamide gel electrophoresis/silver staining (upper panel), and immunoblotting (lower panels), as indicated. This Figure is reproduced in colour in Molecular Membrane Biology online.
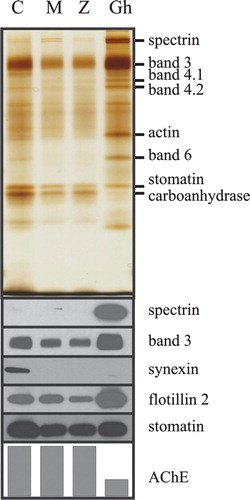
Table I. Differential segregation of membrane proteins into erythrocyte vesicles.
Table II. Accumulation of raft markers in human erythrocyte exvaginations and invaginations as studied by fluorescence microscopy.
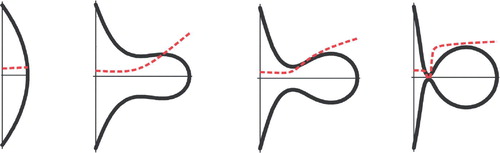
Figure 4. Intrinsic shapes of membrane components. Schematic figure of different intrinsic shapes (characterized by two intrinsic curvatures C1m and C2m) of membrane components which may be single molecules (A,B) or small complexes of molecules (C,D). Shapes A, C and D are anisotropic, shape B is isotropic.
Figure 5. Accumulation of membrane components in the budding region. Relative concentration of membrane components (raft elements) characterized by positive C1m=C2m and negative w during the budding/vesiculation of the membrane is shown (dotted line). See the Appendix for details.