Figures & data
Figure 1. AFM Images demonstrating the membrane isolation procedure (a) before exposure to shear stress, revealing intact RBC with a height of ∼2 µm adsorbed to glass and (b) after application of the jet stream, resulting in flat inside-out oriented membranes with circular shapes and diameters of ∼8 µm. Heights of the isolated plasma membranes including the protruding membrane proteins were between 10 and 15 nm.
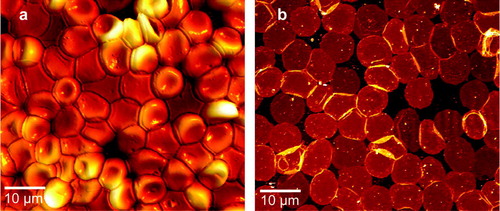
Figure 2. Immunostaining of CFTR in isolated RBC membrane patches with Qdot-labeled antibodies. The upper panel represents fluorescence images of non-CF (a) and CF (b) RBC membrane patches. Each inset shows a single membrane with clearly distinguishable bright fluorescence events. The lower panel shows AFM images of non-CF (c) and CF (d) RBC membrane patches. High-resolution zoom-in scans, shown in (c) (1×1 µm) and (d) (1.3×1.3 µm) identify the Qdot as high structures (∼15 nm, color code: white) with specific shapes. It is evident that the number of Qdot-labeled CFTR molecules is much higher in non-CF RBC than in CF RBC.
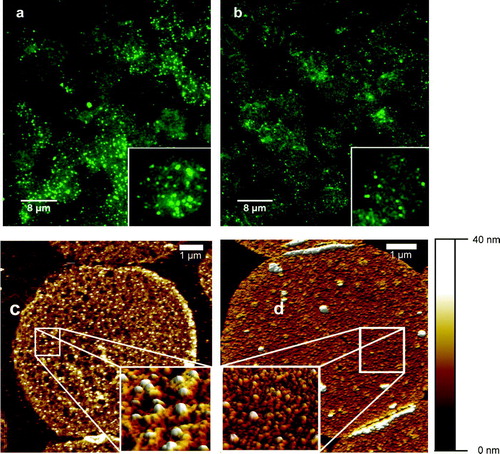
Figure 3. Adhesion force measurements to distinguish between proteins and Qdots. Force-distance measurements performed on a protein (inset a) and on a Qdot (inset b). The measured adhesion force (indicated by the arrows) between the tip and the protein was 19±0.9 nN (n=50), while the Qdot exhibited an adhesion force of 4±0.3 nN (n=50). Determining the adhesion forces made it possible to distinguish structures with similar heights and shapes.
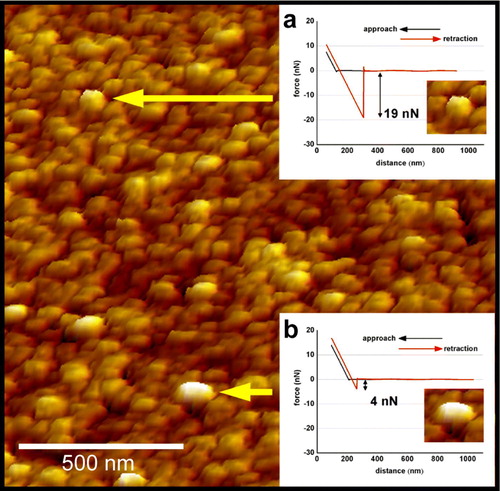
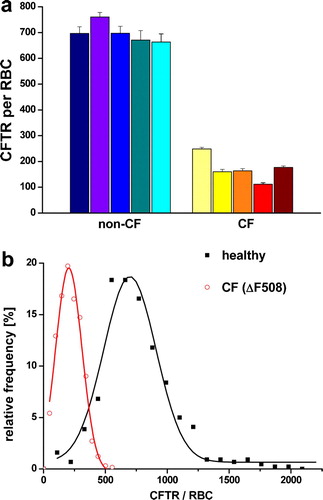
Figure 4. (a) Single molecule counting of Qdot-labeled CFTR molecules. Each column represents one individual showing the mean (±SEM) of 100–120 RBC membrane patches. (b) Summarized histograms revealing Gaussian distribution for the non-CF population (black curve) with a peak value of 698 CFTR molecules per RBC (n=542) and for CF-patients (grey curve and red curve on-line) with a peak value of 204 CFTR molecules per RBC (n=538). Since the isolated membrane patches represent only approximately 40% of the RBC membrane, the results were extrapolated to the total RBC surface area of 130 µm2.