
Figures & data
Figure 1. Remotely sensed terrestrial carbon fluxes retrieved from satellite spectral bands of the electromagnetic spectrum. GPP, NPP, NEP and NBP denotes gross primary productivity, net primary productivity, net ecosystem productivity and net biome productivity, respectively. The values in black denote satellite-derived estimates and those in gray represent estimates inferred from satellite derivation. Note that the NPP estimate is derived from MODIS data. Negative sign indicates a source of CO2 to the atmosphere.
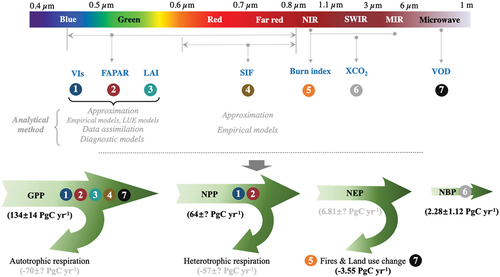
Figure 2. Spatial patterns of mean and standard deviation of annual gross primary production (GPP) and its trends in the last two decades. (a and b) the mean and standard deviation annual GPP from different GPP products, (c and d) the mean and standard deviation of trends in annual GPP in the last two decades from different products, and (e) the time series of global annual GPP for the four different GPP products (MODIS, BESS, GOSIF and PML), the flux-derived GPP, and multi-model mean from TRENDY project. Here the flux-derived GPP data (https://doi.org/10.3334/ORNLDAAC/1835) is the upscaling of eddy covariance flux measurements from selected FLUXNET 2015 to the global scale in a machine learning algorithm using nadir bidirectional reflectance distribution function (BRDF)-adjusted reflectances (NBAR) product as inputs.
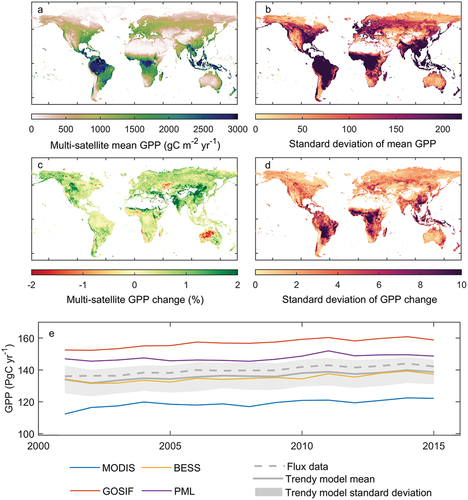
Figure 3. The comparison of terrestrial carbon fluxes among satellite derivation, model simulations and inventory-based approach at both regional and global scales. GPP and NBP are gross primary productivity and net biome productivity, respectively, and Dflux represents carbon fluxes associated with wildfire disturbance and land-use change. The GPP and NBP in black represents the satellite-based estimates during periods 2000–2022 and 2015–2020, respectively. The NBP in gray stems from the latest comprehensive bottom-up carbon accounting approach and this value is calculated as the sum of inventory-based carbon stock changes and lateral carbon fluxes (crop and wood trade, and riverine-carbon export to the ocean) during the period 2000–2009. The model-based GPP and NBP during the period 2010–2018 are derived from TRENDY model simulations under S3 simulation scenario (with time-varying climate, CO2 concentration and land-use).
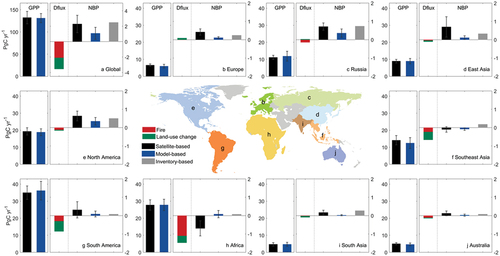
Table 1. The main flux components of global and regional carbon balance. Note that only GPP, NPP, disturbance flux and NBP are remotely sensed. Other components such as soil and ecosystem respiration, and NEP are deduced from remotely sensed fluxes. Negative sign indicates a carbon source. The time periods used to obtain GPP, disturbance flux and NBP are 2000–2022, 2012–2021 and 2015–2020, respectively.
Data availability statement
The TRENDY project dataset can be downloaded https://blogs.exeter.ac.uk/trendy/protocol/. The BESS data is available from https://www.environment.snu.ac.kr/bess-flux/. The GOSIF database can be accessed at http://data.globalecology.unh.edu/data/GOSIF-GPP_v2/. The MODIS GPP data was derived from https://modis.gsfc.nasa.gov/data/dataprod/mod17.php/. The fire carbon emissions data are available from http://www.globalfiredata.org/. Other datasets supporting the findings of this manuscript are available in the main text.