
Figures & data
Figure 1. Location of study area, Yunxiao County Fujian Province, China (a); a true color composite from Sentinel-2 data (b), and collected samples of vegetation types (c).
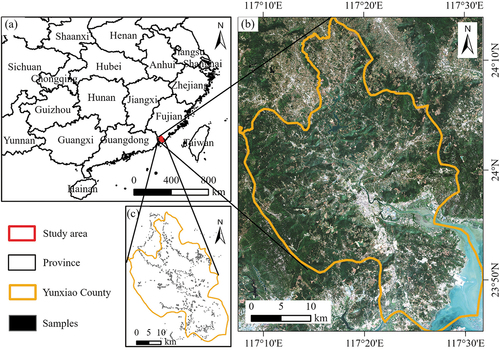
Table 1. Samples of different vegetation types.
Figure 2. Time series Sentinel-2 data of other broadleaf forest (OBL) in different spectral bands: (a) near-infrared (band 8), (b) red edge 1 (band 5), (c) shortwave infrared 1 (band 11).
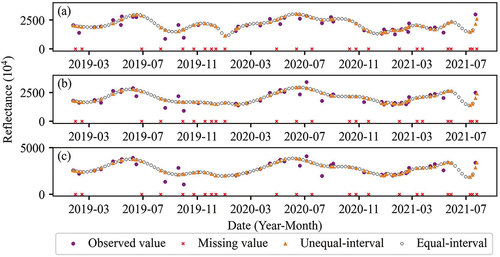
Table 2. Date distribution and valid value ratios of Sentinel-2 image used in this study.
Figure 3. Time series near-infrared reflectance (a) and corresponding recurrence plots for eucalyptus (b), loquat (c), and honey pomelo (d).
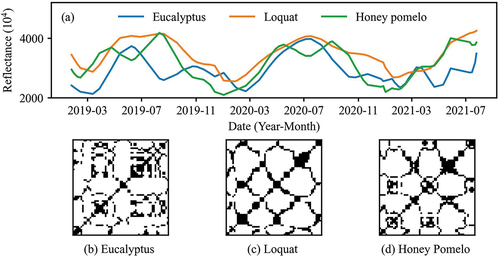
Figure 4. The network structure of Conv1D. Concat operation concatenates the features from previous layers.
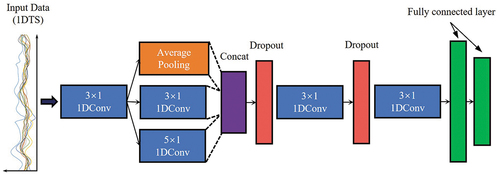
Figure 5. Structure of GoogLeNet with recurrence plot data input (a), inception module used in GoogLeNet (b).
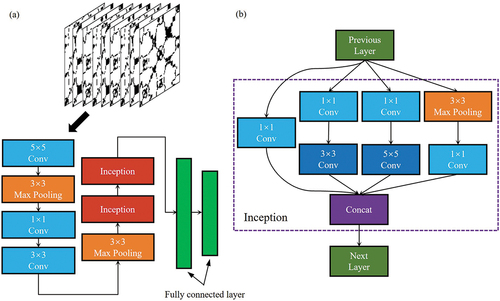
Figure 6. F1 scores of different models for unequal-interval and equal-interval time series data.
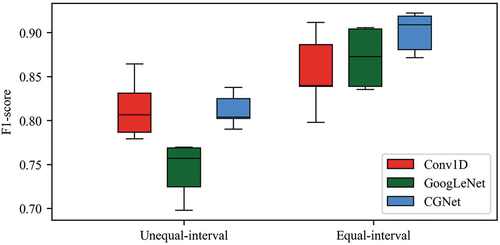
Table 3. F1 scores for each vegetation category and overall from different classification models.
Figure 7. Features visualization of (a) original bands, (b) Conv1D, (c) GoogLeNet, and (d) CGNet.
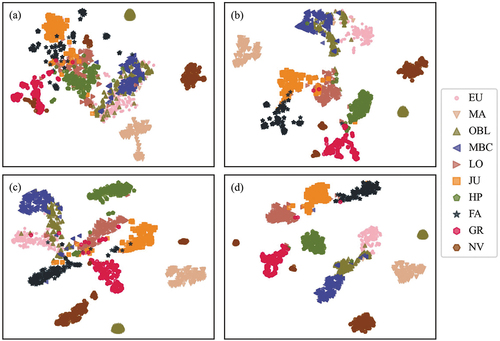
Figure 8. Distances between different vegetation categories in (a) original bands, (b) features of Conv1D, (c) features of GoogLeNet, and (d) features of CGNet.
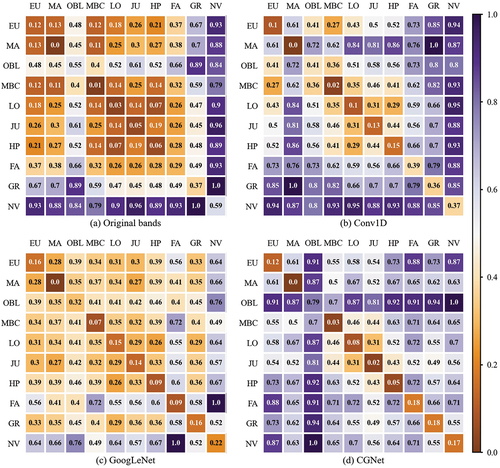
Figure 9. Gradient curves of eucalyptus, loquat, and honey pomelo in Conv1D for ten spectral bands. (a) Eucalyptus, (b) Loquat, (c) Honey pomelo.
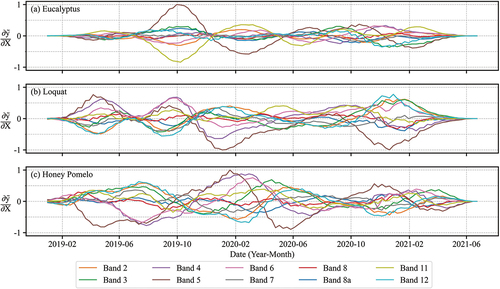
Table 4. Band importance rankings for eucalyptus, loquat, and honey pomelo in two models.
Figure 10. Gradients distribution of recurrence plot in GoogLeNet for ten spectral bands. (a) Eucalyptus, (b) Loquat, (c) Honey pomelo.
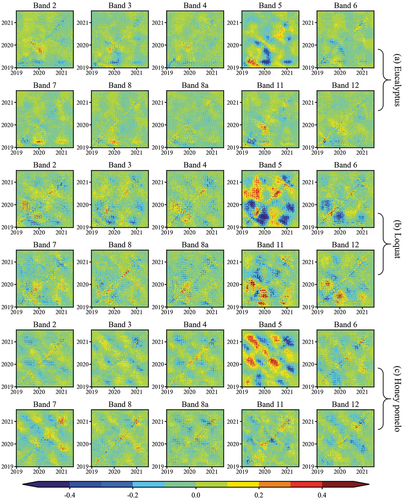
Figure 11. Spatial distributions of vegetation types in the study area classified by Conv1D (a1), GoogLeNet (a2), and CGNet (a3). A local map of classification results: High-resolution drone image (b1), Visual interpretation (b2), Conv1D (b3), GoogLeNet (b4), CGNet (b5).
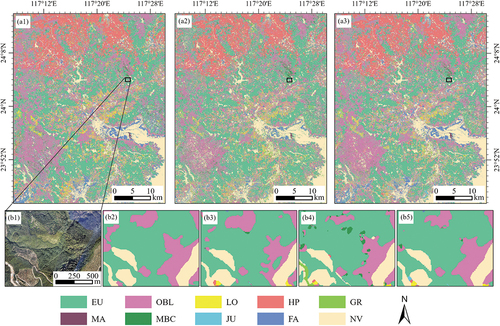
Table 5. Time costs (hours) in different models and data.