Figures & data
Figure 1. Schematic timeline of experimental procedures. (A) In the first part of the experiment, naïve mice were habituated for a period of 7 d (green) to the home cages of the TSE PhenoMaster system after which 24 h (12 h light and 12 h dark; 10:00–10:00 h) of behavioral recording was collected (Baseline) prior to application of a 2 h restraint stress (10:00–12:00 h; red). Following stress application, mice were returned to the home cages and behavioral recording was continuously collected for 96 h (12:00–12:00 h; blue). (B) In the second part of the experiment, naïve mice were habituated for a period of 7 d (green) followed by a single intraperitoneal injection of diazepam (DZP; 5 mg kg−1) or vehicle (VEH) at 09:30 h. After 30 min, recordings were collected for 2 h for initial response to injection (10:00–12:00 h) and a further 48 consecutive hours (12:00–12:00 h; blue). (C) The third experiment involved a similar experimental procedure to Part A with the inclusion of the single intraperitoneal injection of DZP or VEH 30 min prior (09:30 h; black) to application of a 2 h restraint stress (10:00–12:00 h; red). (D) In the last experiment, naïve mice were habituated for a period of 7 d (green). The baseline blood samples were collected from the tail, followed by a single intraperitoneal injection of DZP or VEH 30 min prior (09:30 h; black) to application of a 2 h restraint stress (10:00–12:00 h; red). Subsequent blood samples were collected at 1 h (11:00 h) and 2 h (12:00 h) time points following restraint stress application.
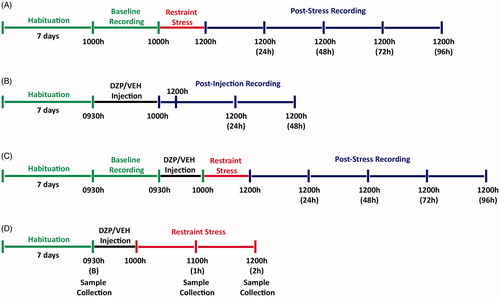
Figure 2. Single episode of two-hour restraint stress induces a prolonged reduction in locomotor and fine activity but no change in metabolic rate. Line graphs of continuous recording of (A) total locomotor activity, (D) fine activity, and (H) oxygen consumption during the dark (grey) and light (white) phase prior to and after acute restraint stress exposure (n = 12). The standard errors of mean (SEM) are indicated by dashed lines. The red vertical line depicts time of restraint. Mean ± SEM cumulative counts per 24 h in (B) total locomotor activity and (F) fine activity were recorded for 96 h following acute restraint stress (blue) when compared to the baseline recording (“B”; green). These were separated into light and dark phase components for up to 96 h following restraint stress (C & G). (E) Fine activity for 4 h following acute restraint stress (blue) was compared to the fine activity prior to restraint stress application (green). (I) Mean ± SEM cumulative 24 h measurements of oxygen consumption prior to and after acute restraint stress exposure were monitored for up to 96 h and (J) shows linear regression of metabolic rates (energy expenditure relative to body weight) at baseline (green) and 24 h (blue) after restraint stress. *p < .05, **p < .01, ***p < .001 when compared to baseline recording; repeated measures one-way ANOVA with Dunnett’s test.
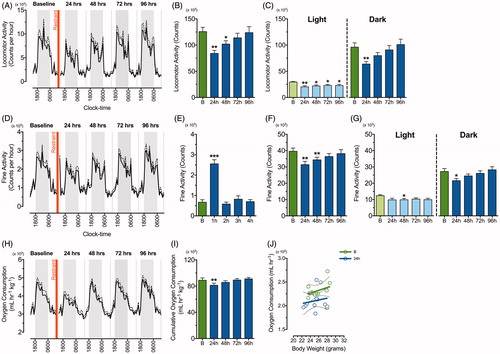
Figure 3. Diazepam alone does not affect oxygen consumption, locomotor and fine activity. A line graph demonstrating continuous recording of (A) total locomotor activity and (D) fine activity during the dark (grey) and light (white) phase after vehicle (green line) and diazepam (blue line) injection (n = 8 per group). The standard errors of mean (SEM) are illustrated as dashed green and blue lines. (B & E) Locomoter and fine activity for 4 h following acute restraint stress was compared between vehicle (green bar) and diazepam (blue bar). Mean ± SEM cumulative 24 h measurements in (C) locomotor activity, (F) fine activity and (G) oxygen consumption were compared in mice treated with vehicle (green bar) and diazepam (blue bar) at 24 and 48 h post injection (n = 8 per group). ***p < .001 when comparing between vehicle and diazepam at each time point; repeated measures two-way ANOVA with Fisher’s LSD test.
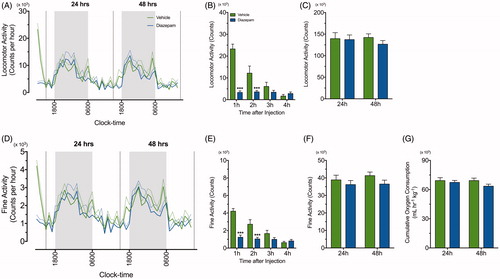
Figure 4. Diazepam facilitates recovery of locomotor activity following a single episode of two-hour restraint stress. A line graph demonstrating continuous recording of (A) total locomotor activity and (D) fine activity during the dark (grey) and light (white) phase after acute restraint stress exposure in vehicle (green line) and diazepam (blue line) treated mice (n = 8 per group). The standard errors of mean (SEM) was illustrated as dashed green and blue lines. The red vertical line depicts time of restraint. Cumulative 24 h counts in (B) locomotor and (E) fine activity from mice treated with vehicle (green bar) and diazepam (blue bar) were recorded for 96 h following acute restraint stress. Cumulative 24 h measurements for locomotor and fine activity were separated into light and dark phase for 96 h following acute restraint stress (C & F). *p < .05, **p < .01, ***p < .001 when comparing between vehicle and diazepam at each time point; repeated measures two-way ANOVA with Fisher’s LSD test.
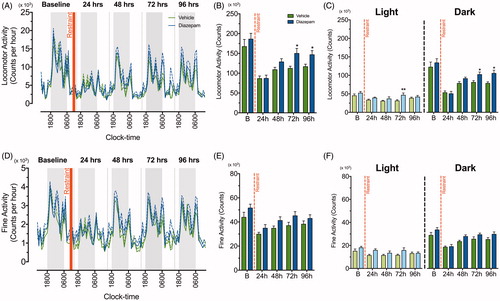
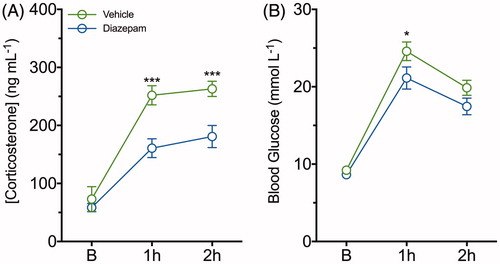
Figure 5. Diazepam dampens restraint-evoked plasma corticosterone and blood glucose concentrations following a single episode of two-hour restraint stress. (A) Plasma corticosterone and (B) blood glucose concentrations were determined from serial blood samples collected at baseline, 1 and 2 h of restraint-stress in vehicle (green line) and diazepam (blue line) treated mice. Data are represented as mean ± SEM from eight mice per group; *p < .05, ***p < .001 when comparing between vehicle and diazepam at each time point; repeated measures two-way ANOVA with Fisher’s LSD test.