Figures & data
Figure 1. Experiment schematic time line expressed in days of age (DA). To analyze immunoendocrine system and biochemical stress induced modulations, eight sampling days were defined (#1–8). Female Japanese quail were submitted to a chronic heat stress protocol during nine days (DA 30–38) and was followed by a recovery period of 12 days (DA 39–50). Heat stress protocol: temperature in half of the boxes was daily increased from 24 to 34 °C, during the photoperiod light phase. Recovery period: temperature in stressed boxes was established at a continuous comfort temperature (24 °C). On each sampling day, 12 stressed and 12 non-stressed quail were sampled. Each bird was sampled only once.
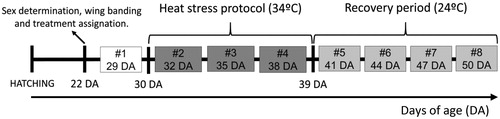
Figure 2. Effects of chronic heat stress (during nineconsecutive days) and the recovery during the following 12 days on the plasma concentration of corticosterone in female Japanese quail. Points represent mean value and lines represent standard error of the mean. The age of sampling is shown in the time axis (age, days). Day 29 corresponds to the sample day before heat stress (34 °C) started. Days 32, 35, and 38 correspond to sampling during heat stress exposure. Days 41, 44, 47, and 50 correspond to sampling after the chronic heat stress protocol was finished. a, b: different letters represent significant differences between groups (p < 0.05; Tukey post-hoc test). A total of 24 birds (12 stressed and 12 control) were sampled on each of the eight sampling days (192 birds total). Each bird was sampled only once.
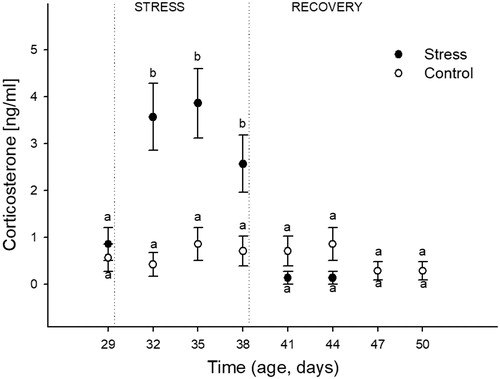
Figure 3. Effects of chronic heat stress exposure (during nine consecutive days) and the recovery during the following 12 days on the percentage of inflammation induced by the injection of phytohemagglutinin-p in female Japanese quail. Percentage of Inflammation = (Wing-web measurement (mm) 24 h prior to sampling day/Wing-web measurement (mm) on the sampling day) x 100. Points represent mean value and lines represent standard error of the mean. The age of sampling is shown in the time axis (age, days). Day 29 correspond to the sample day before heat stress (34 °C) started. Days 32, 35, and 38 correspond to sampling during heat stress exposure. Days 41, 44, 47, and 50 correspond to sampling after the chronic heat stress protocol was finished. a–c: different letters represent significant differences between groups (p < 0.05; Tukey post-hoc test). A total of 24 birds (12 stressed and 12 control) were sampled on each of the eight sampling days (192 birds total). Each bird was sampled only once.
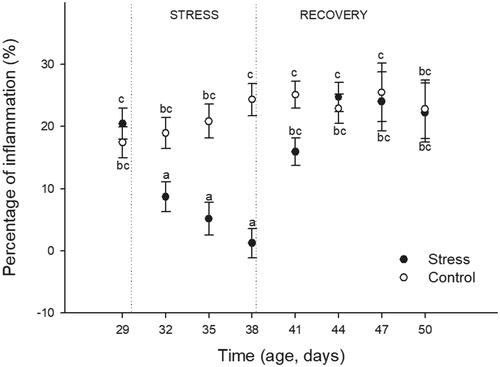
Figure 4. Effects of chronic heat stress (during nine consecutive days) and recovery during the following 12 days on heterophil to lymphocyte ratio in female Japanese quail. Points represent mean value and lines represent standard error of the mean. The age of sampling is shown in the time axis (age, days). Day 29 correspond to the sample day before heat stress (34 °C) started. Days 32, 35, and 38 correspond to sampling during heat stress exposure. Days 41, 44, 47, and 50 correspond to sampling after chronic heat stress protocol was finished. (a–f) different letters represents significant differences between groups (p < 0.05; Tukey post-hoc test). A total of 24 birds (12 stressed and 12 control) were sampled on each of the eight sampling days (192 birds total). Each bird was sampled only once.
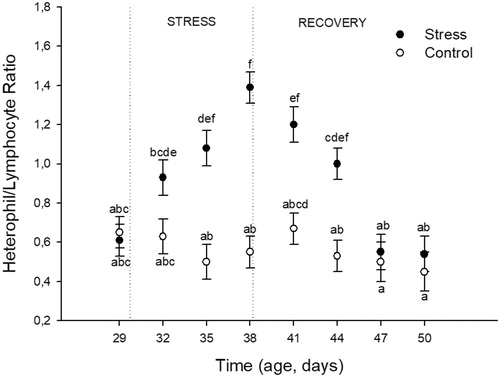
Figure 5. Effects of chronic heat stress (during nine consecutive days) and recovery during the following 12 days on antibody titers against sheep red blood cells (SRBC) in female Japanese quail. One week before each sampling day, the corresponding birds were immunized against SRBC. Points represent mean value and lines represent standard error. The age of sampling is shown in the time axis (age, days). Day 29 correspond to the sample day before heat stress (34 °C) started. Days 32, 35, and 38 correspond to sampling during heat stress exposure. Days 41, 44, 47, and 50 correspond to sampling after chronic heat stress protocol was finished. (a–f) different letters represent significant differences between groups (p < 0.05; Tukey post-hoc test). A total of 24 birds (12 stressed and 12 control) were sampled on each of the eight sampling days (192 birds total). Each bird was sampled only once.
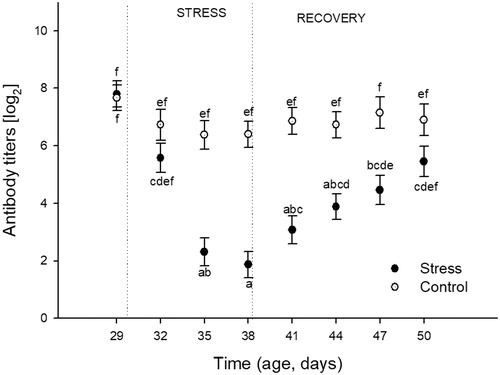
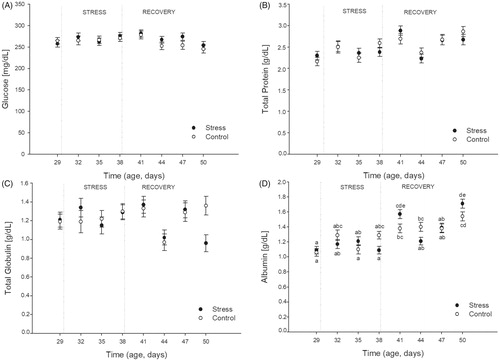
Figure 6. Effects of chronic heat stress (during nine consecutive days) and recovery during the following 12 days on plasma concentrations of glucose (panel A), total proteins (panel B), total globulins (Panel C), and albumin (Panel D) in female Japanese quail. Points represent mean value and lines represent standard error of the mean. The age of sampling is shown in the time axis (age, days). Day 29 correspond to the sample day before heat stress (34 °C) started. Days 32, 35, and 38 correspond to sampling during heat stress exposure. Days 41, 44, 47, and 50 correspond to sampling after chronic heat stress protocol was finished. (a–e) Different letters represents significant differences between groups (p < 0.05; Tukey post-hoc test). A total of 24 birds (12 stressed and 12 control) were sampled on each of the eight sampling days (192 birds total). Each bird was sampled only once.