Figures & data
Figure 1. Schematic illustration of the procedure. After a rest phase, participants performed AUT before and after the Montreal Imaging Stress Task (MIST). Saliva from the participants for further measurement was collected at five time points (–40, –8, 0, 6, and 14 min in relation to the onset of the stressful task) which was shown on the timeline.
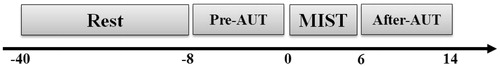
Figure 2. Procedure of AUT. Each trial began with the presentation of a fixation cross for 10 s (reference period). Then the stimulus word appeared for 4 s on the screen (e.g. brick). During the presentation of the white question mark, the participants were required to think of useful and original ideas for the stimulus for 10 s (activation period). Subsequently, the presentation of “作答” indicated that the participant was required to articulate his or her most original idea within 4 s. Finally, the participants were asked to evaluate their responses as either “original” or “not original” using a keyboard press on the corresponding button (figure adapted from Fink et al., Citation2011).
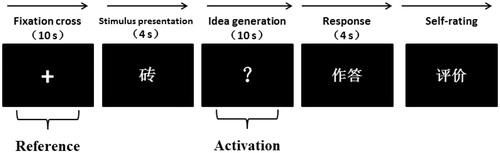
Figure 3. Mean levels of negative effect (from the PANAS questionnaire) as a function of time in minutes following the onset of the stress or control intervention. The intervention began at Time 1 and lasted until Time 2. The experiment ended at Time 3. Results revealed a significant main negative effect (p = 0.004) and a significant increase in negative effect from Time 1 to Time 2 (p = 0.01), and from Time 1 to Time 3 (p = 0.037). Error bars represent SEM. *p < 0.05. **p < 0.01.
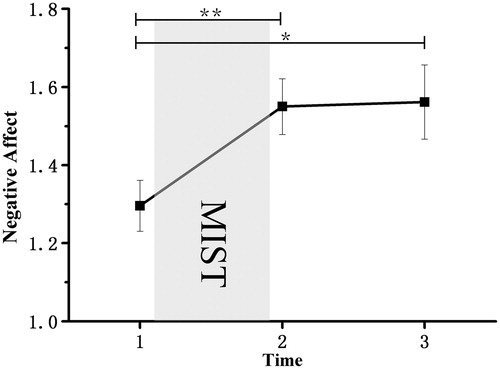
Figure 4. (A) Mean salivary cortisol (nmol/L) and (B) salivary alpha-amylase (U/ml) as a function of time (minutes following intervention onset) for the stress. The stress intervention began at Time 2 and lasted until Time 3. The experiment started and ended at Time 1 and Time 4. Results revealed a significant main effect of time on both biological indicators for salivary cortisol and salivary alpha-amylase (all p-values < 0.001). Furthermore, the cortisol levels at Time 1 were significantly lower than those at Time 2, Time 3, and Time 4 (p < 0.001 for all). There was also a significant difference in cortisol levels between Time 2 and Time 4 (p < 0.01). The cortisol levels at Time 3 did not show a difference with Time 4. The similar findings were observed in the levels of salivary alpha-amylase. Error bars represent SEM. **p < 0.01. ***p < 0.001
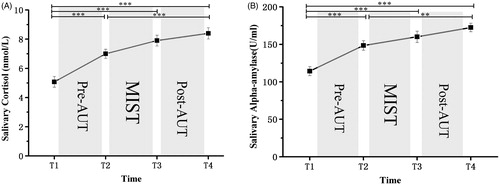
Figure 5. Alternative Uses Test scores before stress and after stress. Results revealed that before-stress scores were significantly higher than the after-stress scores (p < 0.01). **p < 0.01.
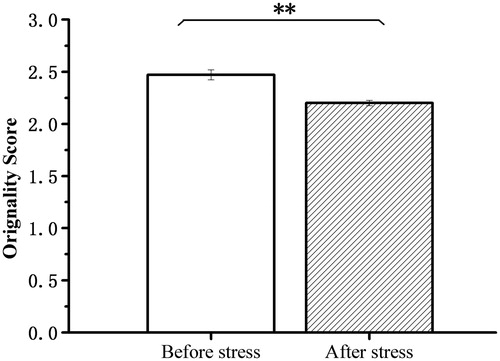
Figure 6. Means and standard error bars for task-related alpha power changes (10–12 Hz) during creative idea generation ((A) represented before stress and (B) represented after stress) for eight cortical areas in the right and left hemispheres (abbreviations for cortical sites are used according to the international 10-20 system [Jasper, 1958]: FP = frontopolar, F = frontal, C = central, P = parietal, O = occipital, T = temporal; odd numbers represent cortical sites in the left hemisphere, whereas even numbers correspond to cortical sites in the right hemisphere). The ANOVA revealed a significant main effect of STRESS, with larger TRP values observed before stress than after stress (p < 0.001) and a significant main effect of HEMISPHERE, with larger values observed in the right hemisphere than left hemisphere (p = 0.003) and a significant main effect on TIME (p < 0.001). Furthermore, TRP values in interval 1 were higher than interval 2 and interval 3 (all p-values < 0.001). In addition, we found HEMISPHERE × TIME (p = 0.008), HEMISPHERE × POSITION (p = 0.015) and STRESS × HEMISPHERE × TIME (p = 0.043) interactions. Bonferroni-corrected simple-effects tests revealed that the TRP values in the right hemisphere were higher than those for the left hemisphere on the parietal and occipital lobes (position on C3C4, T7T8, P3P4, P7P8, and O1O2) (all p-values < 0.05). There were significant differences between before stress and after stress (all p-values < 0.05) except for interval 3 in the right hemisphere. Additionally, the hemisphere differences represented in interval 3 before stress and represented in intervals 2 and 3 after stress (all p-values < 0.01).
![Figure 6. Means and standard error bars for task-related alpha power changes (10–12 Hz) during creative idea generation ((A) represented before stress and (B) represented after stress) for eight cortical areas in the right and left hemispheres (abbreviations for cortical sites are used according to the international 10-20 system [Jasper, 1958]: FP = frontopolar, F = frontal, C = central, P = parietal, O = occipital, T = temporal; odd numbers represent cortical sites in the left hemisphere, whereas even numbers correspond to cortical sites in the right hemisphere). The ANOVA revealed a significant main effect of STRESS, with larger TRP values observed before stress than after stress (p < 0.001) and a significant main effect of HEMISPHERE, with larger values observed in the right hemisphere than left hemisphere (p = 0.003) and a significant main effect on TIME (p < 0.001). Furthermore, TRP values in interval 1 were higher than interval 2 and interval 3 (all p-values < 0.001). In addition, we found HEMISPHERE × TIME (p = 0.008), HEMISPHERE × POSITION (p = 0.015) and STRESS × HEMISPHERE × TIME (p = 0.043) interactions. Bonferroni-corrected simple-effects tests revealed that the TRP values in the right hemisphere were higher than those for the left hemisphere on the parietal and occipital lobes (position on C3C4, T7T8, P3P4, P7P8, and O1O2) (all p-values < 0.05). There were significant differences between before stress and after stress (all p-values < 0.05) except for interval 3 in the right hemisphere. Additionally, the hemisphere differences represented in interval 3 before stress and represented in intervals 2 and 3 after stress (all p-values < 0.01).](/cms/asset/617efa86-c41a-4e8a-a53f-26a366e539da/ists_a_1604665_f0006_c.jpg)
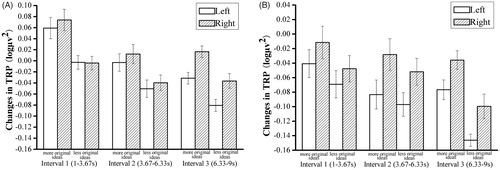
Figure 7. Means and standard error bars of task-related alpha power changes (10–12 Hz) during creative idea generation for more versus less original ideas before stress (A) and after stress (B). The results before stress (A) revealed a main effect of ORIGINALITY (p = .018), TIME (p < 0.001) and HEMISPHERE (p = 0.035). The stronger increase in TRP in the right hemisphere was more pronounced in trials with more (vs. less) original ideas. In addition, the participants with more original ideas had higher TRP values than those with less original ideas in every interval. There was also a significant interaction effect on HEMISPHERE × TIME (p = 0.01). Furthermore, there was a significant difference between interval 1, interval 2, and interval 3 in the left hemisphere (all p-values < 0.05) and a significant difference between interval 1 and interval 2 in the right hemisphere (p = 0.005). The results after stress (B) revealed no main effect of idea originality (p = 0.197). However, there was a main effect of HEMISPHERE (p = 0.004) and TIME (p = 0.048). Post-hoc results showed that changes in the right hemisphere were more pronounced than left hemisphere, whereas there was no difference in intervals 1, 2, or 3.