Figures & data
Figure 1. Timeline of the experiment. In the habituation phase (minute 0–15), participants gave informed consent and completed a self-developed questionnaire rating different properties of the experimental room. After 15 min, the first baseline measurement was conducted (minute 15–17), including a salivary sample, the completion of a visual analogue scale (VAS), and a cardiovascular measurement. Then, the Trier Social Stress Test took place (TSST; Kirschbaum et al., Citation1993, minute 17–32). During the preparation period of the TSST, participants completed the Primary Appraisal Secondary Appraisal Scale (PASA; Gaab et al., Citation2005) assessing anticipatory appraisal of the stressful situation. Additional cardiovascular measurements were conducted during the TSST preparation phase and during the stressful task. Following the TSST, three further stress measurements were conducted, directly after the TSST (+15min), 10 min after the end of the TSST (+25min) and 30 min after the end of the TSST (+45min). After this, participants were debriefed and reimbursed.
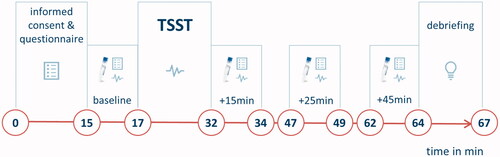
Figure 2. Cortisol stress response displayed by group. Cortisol responder rates (A) were higher in the Hedione than in the control group. The time course of cortisol levels (B) differed between the Hedione (red) and control group (blue). Note. **p < .01. ***p < .001. Shaded errors represent the SEM.
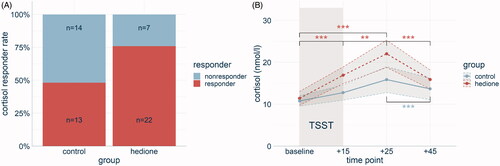
Figure 3. Response of the autonomic nervous system displayed by group. The time course of systolic blood pressure (BP) differed between the two groups, with a stronger increase in the Hedione group (A). The time course of salivary alpha-amylase levels did not differ between the groups (B). Note. *p < .05. Shaded errors represent the SEM.
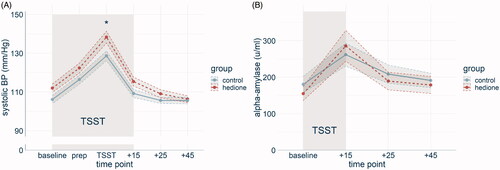
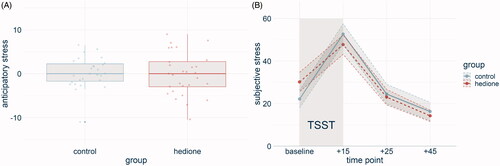
Figure 4. Subjective stress displayed by group. No differences emerged between the groups in anticipatory stress (A) and subjective stress over the time course of the experiment (B). Note. Shaded errors represent the SEM.