Publication Cover
Stress
The International Journal on the Biology of Stress
Volume 11, 2008 - Issue 1
739
Views
51
CrossRef citations to date
0
Altmetric
Original

Chronic administration of an angiotensin II receptor antagonist resets the hypothalamic–pituitary–adrenal (HPA) axis and improves the affect of patients with diabetes mellitus type 2: Preliminary results

Research Report

, , , , , , , , & show all
Pages 62-72 | Received 09 Feb 2007, Accepted 28 May 2007, Published online: 07 Jul 2009

Figures & data

Table I.  Anthropometric, clinical and biochemical characteristics before and after candesartan administration (BMI, body mass index; UFC, urine free cortisol; CBG, cortisol-binding globulin; Glu, glucose; HOMA, the homeostasis model assessment; HbA1c, glycosylated Hb A1c; QUICKI, quantitative insulin sensitivity check index; SEM, standard error of the mean).

Figure 1 (A) Mean ± SEM plasama ACTH (pg/mL) response to hCRH in DM type 2 patients before (closed squares) and after (open squares) candesartan administration. Asterisks indicate statistically significant difference at the indicated time-point. P = 0.0017, n = 17. (a) Mean ± SEM AUC values of plasma ACTH in DM type 2 patients before (black bars) does not differ from that after (white bars) candesartan administration. (n = 17). (B) Mean ± SEM serum cortisol (μg/dl) response to hCRH in DM type 2 patients before (closed squares) and after (open squares) candesartan administration. Asterisks indicate statistically significant difference at the indicated time-point. − 1 min: P = 0.031; 5 min: P = 0.021; 15 min: P = 0.022; 30 min: P = 0.034; 90 min: P = 0.041; n = 17. (b) Mean ± SEM AUC values of serum cortisol in DM type 2 patients before (black bars) and after (white bars) candesartan administration. Asterisks indicate statistically significant difference at the indicated time-point. P = 0.005, n = 17. (C) Mean ± SEM plasma ACTH (expressed in pg/ml)/serum cortisol (expressed in μg/dl) ratios at the different time-points of the hCRH test in DM type 2 patients before (closed squares) and after (open squares) candesartan administration. Asterisks indicate statistically significant difference at the indicated time-point. − 1 min: P = 0.045; 5 min: P = 0.01; 90 min: P = 0.034; 120 min: P = 0.021; n = 17. (c) Mean ± SEM AUC values of plasma ACTH (expressed in pg/ml)/serum cortisol (expressed in μg/dl) ratios in DM type 2 patients before (black bars) and after (white bars) candesartan administration. Asterisks indicate statistically significant difference at the indicated time-point. P = 0.017, n = 17.
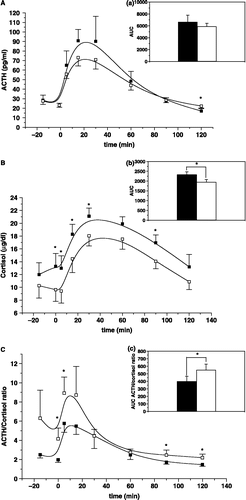
Figure 1 (A) Mean ± SEM plasama ACTH (pg/mL) response to hCRH in DM type 2 patients before (closed squares) and after (open squares) candesartan administration. Asterisks indicate statistically significant difference at the indicated time-point. P = 0.0017, n = 17. (a) Mean ± SEM AUC values of plasma ACTH in DM type 2 patients before (black bars) does not differ from that after (white bars) candesartan administration. (n = 17). (B) Mean ± SEM serum cortisol (μg/dl) response to hCRH in DM type 2 patients before (closed squares) and after (open squares) candesartan administration. Asterisks indicate statistically significant difference at the indicated time-point. − 1 min: P = 0.031; 5 min: P = 0.021; 15 min: P = 0.022; 30 min: P = 0.034; 90 min: P = 0.041; n = 17. (b) Mean ± SEM AUC values of serum cortisol in DM type 2 patients before (black bars) and after (white bars) candesartan administration. Asterisks indicate statistically significant difference at the indicated time-point. P = 0.005, n = 17. (C) Mean ± SEM plasma ACTH (expressed in pg/ml)/serum cortisol (expressed in μg/dl) ratios at the different time-points of the hCRH test in DM type 2 patients before (closed squares) and after (open squares) candesartan administration. Asterisks indicate statistically significant difference at the indicated time-point. − 1 min: P = 0.045; 5 min: P = 0.01; 90 min: P = 0.034; 120 min: P = 0.021; n = 17. (c) Mean ± SEM AUC values of plasma ACTH (expressed in pg/ml)/serum cortisol (expressed in μg/dl) ratios in DM type 2 patients before (black bars) and after (white bars) candesartan administration. Asterisks indicate statistically significant difference at the indicated time-point. P = 0.017, n = 17.

Reprints and Corporate Permissions

Please note: Selecting permissions does not provide access to the full text of the article, please see our help page How do I view content?

To request a reprint or corporate permissions for this article, please click on the relevant link below:

Academic Permissions

Please note: Selecting permissions does not provide access to the full text of the article, please see our help page How do I view content?

Obtain permissions instantly via Rightslink by clicking on the button below:

If you are unable to obtain permissions via Rightslink, please complete and submit this Permissions form. For more information, please visit our Permissions help page.