Publication Cover
Stress
The International Journal on the Biology of Stress
Volume 11, 2008 - Issue 2
650
Views
45
CrossRef citations to date
0
Altmetric
Original

Water temperature determines neurochemical and behavioural responses to forced swim stress: An in vivo microdialysis and biotelemetry study in rats

Research Report

, &
Pages 88-100 | Received 19 Mar 2007, Accepted 24 Jun 2007, Published online: 07 Jul 2009

Figures & data

Figure 1 Effects of forced swim stress at different water temperatures on hippocampal extracellular concentrations of 5-HT (A) and 5-HIAA (B; % of baseline) as assessed by in vivo microdialysis. After collection of nine 15-min baseline samples, rats were forced to swim for 15 min (swim sample is indicated by the arrow) in water at 19, 25 or 35°C. After return to the home cage another fourteen 15-min samples were collected. Time points on the x-axis indicate time of day at which collection of the sample was started. *, significantly different from baseline for 35°C; +, significantly different from baseline for 25°C; #, significantly different from baseline for 19°C (Bonferroni corrected simple contrasts). a, 19°C significantly different from 25 and 35°C; b, 19°C significantly different from 35°C; c, 25°C significantly different from 35°C (Scheffé post hoc comparisons). For ANOVA analyses see text under “Results”. 5-HT basal values were 6.70 ± 0.62 fmol/15 min sample (n = 18); 5-HIAA basal values were 5.5 ± 3.4 pmol/15 min sample (n = 19).
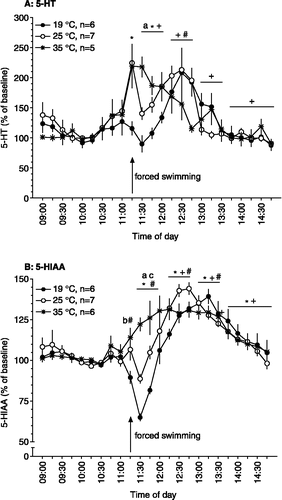
Figure 1 Effects of forced swim stress at different water temperatures on hippocampal extracellular concentrations of 5-HT (A) and 5-HIAA (B; % of baseline) as assessed by in vivo microdialysis. After collection of nine 15-min baseline samples, rats were forced to swim for 15 min (swim sample is indicated by the arrow) in water at 19, 25 or 35°C. After return to the home cage another fourteen 15-min samples were collected. Time points on the x-axis indicate time of day at which collection of the sample was started. *, significantly different from baseline for 35°C; +, significantly different from baseline for 25°C; #, significantly different from baseline for 19°C (Bonferroni corrected simple contrasts). a, 19°C significantly different from 25 and 35°C; b, 19°C significantly different from 35°C; c, 25°C significantly different from 35°C (Scheffé post hoc comparisons). For ANOVA analyses see text under “Results”. 5-HT basal values were 6.70 ± 0.62 fmol/15 min sample (n = 18); 5-HIAA basal values were 5.5 ± 3.4 pmol/15 min sample (n = 19).

Figure 2 Behaviour displayed by rats during a 15-min forced swim session at different water temperatures (19 (n = 6), 25 (n = 7) or 35 (n = 6) °C; behaviour counts). Rats were equipped with a microdialysis probe for simultaneous assessment of hippocampal 5-HT and 5-HIAA concentrations (). +, significantly different from 19°C; #, significantly different from 25°C (post hoc Scheffé analyses). For ANOVA analyses see text under “Results”. For definition of the behaviours displayed see Materials and Methods.
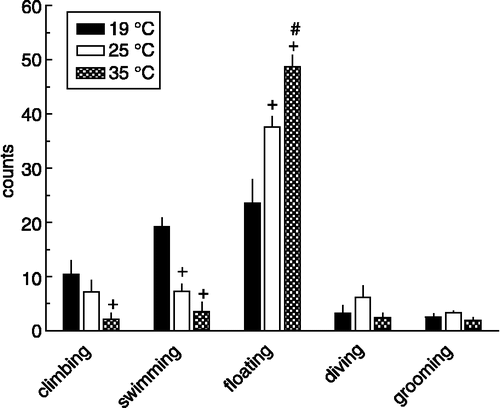
Figure 2 Behaviour displayed by rats during a 15-min forced swim session at different water temperatures (19 (n = 6), 25 (n = 7) or 35 (n = 6) °C; behaviour counts). Rats were equipped with a microdialysis probe for simultaneous assessment of hippocampal 5-HT and 5-HIAA concentrations (Figure 1). +, significantly different from 19°C; #, significantly different from 25°C (post hoc Scheffé analyses). For ANOVA analyses see text under “Results”. For definition of the behaviours displayed see Materials and Methods.
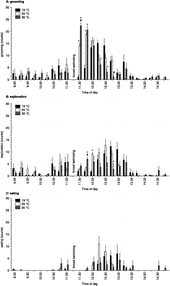
Figure 3 Behaviour displayed by rats in their home cage before and after a 15-min forced swim session at different water temperatures (19 (n = 6), 25 (n = 7) or 35 (n = 6) °C; counts collapsed into 15-min intervals). Rats were equipped with a microdialysis probe for simultaneous assessment of hippocampal 5-HT and 5-HIAA concentrations (). Time points on the x-axis indicate time of day at which collection of the 15-min dialysate sample was started. +, significantly different from 19°C; #, significantly different from 25°C (post hoc Scheffé analyses). For ANOVA analyses see text under “Results”. For definition of the behaviours displayed see Materials and Methods.

Figure 3 Behaviour displayed by rats in their home cage before and after a 15-min forced swim session at different water temperatures (19 (n = 6), 25 (n = 7) or 35 (n = 6) °C; counts collapsed into 15-min intervals). Rats were equipped with a microdialysis probe for simultaneous assessment of hippocampal 5-HT and 5-HIAA concentrations (Figure 1). Time points on the x-axis indicate time of day at which collection of the 15-min dialysate sample was started. +, significantly different from 19°C; #, significantly different from 25°C (post hoc Scheffé analyses). For ANOVA analyses see text under “Results”. For definition of the behaviours displayed see Materials and Methods.

Figure 4 Effects of forced swim stress at different water temperatures on core body temperature (A; °C) and general motor activity (B; arbitrary units) as assessed by in vivo biotelemetry. After measuring baseline core body temperature and motor activity between 09:00 and 11:15 h, rats were forced to swim for 15 min (as indicated by the grey bar and arrow) in water of 19, 25 or 35°C (n = 6 for all groups). After return to the home cage recording continued until 15:00 h. Time points on the x-axis indicate time of day at which the measurement was made. For sake of clarity error bars are not depicted in .
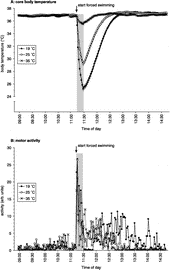
Figure 4 Effects of forced swim stress at different water temperatures on core body temperature (A; °C) and general motor activity (B; arbitrary units) as assessed by in vivo biotelemetry. After measuring baseline core body temperature and motor activity between 09:00 and 11:15 h, rats were forced to swim for 15 min (as indicated by the grey bar and arrow) in water of 19, 25 or 35°C (n = 6 for all groups). After return to the home cage recording continued until 15:00 h. Time points on the x-axis indicate time of day at which the measurement was made. For sake of clarity error bars are not depicted in Figure 4B.

Figure 5 Relationship between the effects of forced swim stress at different water temperatures (19°C: A and B; 25°C: C and D; 35°C: E and F) on core body temperature (closed triangles) and hippocampal extracellular concentrations of 5-HT and 5-HIAA (open triangles). The 2-min body temperature data as depicted in were averaged over 15-min intervals to match the 15-min dialysate sample duration and are here depicted as means ± SEM. For further details, including n-values, see legends to and .
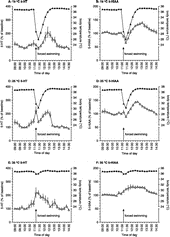
Figure 5 Relationship between the effects of forced swim stress at different water temperatures (19°C: A and B; 25°C: C and D; 35°C: E and F) on core body temperature (closed triangles) and hippocampal extracellular concentrations of 5-HT and 5-HIAA (open triangles). The 2-min body temperature data as depicted in Figure 4A were averaged over 15-min intervals to match the 15-min dialysate sample duration and are here depicted as means ± SEM. For further details, including n-values, see legends to Figures 1 and 4.

Reprints and Corporate Permissions

Please note: Selecting permissions does not provide access to the full text of the article, please see our help page How do I view content?

To request a reprint or corporate permissions for this article, please click on the relevant link below:

Academic Permissions

Please note: Selecting permissions does not provide access to the full text of the article, please see our help page How do I view content?

Obtain permissions instantly via Rightslink by clicking on the button below:

If you are unable to obtain permissions via Rightslink, please complete and submit this Permissions form. For more information, please visit our Permissions help page.