Publication Cover
Stress
The International Journal on the Biology of Stress
Volume 11, 2008 - Issue 2
382
Views
28
CrossRef citations to date
0
Altmetric
Original

Reduction in rat phosphatidylethanolamine binding protein-1 (PEBP1) after chronic corticosterone treatment may be paralleled by cognitive impairment: A first study

, , , , , , , , , , , , , , , & show all
Pages 134-147 | Received 10 Apr 2007, Accepted 23 Aug 2007, Published online: 07 Jul 2009

Figures & data

Table I.  Changes in plasma corticosterone, body weight and protein expression.

Figure 1 Decreasing memory performance after chronic corticosterone treatment for 60 days. Whereas no difference between rats is seen at the start of the experiment, both working memory (number of food-rewarded visits/number of visits and revisits to the baited set of holes in % with SD) and reference memory (number of visits and revisits to the baited set of holes/number of visits and revisits to all holes in % with SD) performances decrease after 60 days of corticosterone treatment (n = 7; *, P < 0.05). Values are mean ± SD.
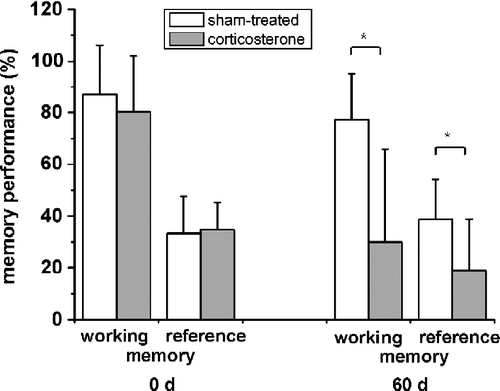
Figure 1 Decreasing memory performance after chronic corticosterone treatment for 60 days. Whereas no difference between rats is seen at the start of the experiment, both working memory (number of food-rewarded visits/number of visits and revisits to the baited set of holes in % with SD) and reference memory (number of visits and revisits to the baited set of holes/number of visits and revisits to all holes in % with SD) performances decrease after 60 days of corticosterone treatment (n = 7; *, P < 0.05). Values are mean ± SD.

Figure 2 Differential expression of hippocampal proteins after chronic corticosterone. (A) The 2D gel electropherogram shows both spots of the corticosterone group (green) and the sham-treated group (purple) in false-color coding. Overlaid spots appear white. The position of phosphatidylethanolamine binding protein (PEBP1, MW approx. 21 kDa) is indicated by an arrow. (B) Three-dimensional reconstruction of the PEBP1 expression data from the 2D gels show decreased PEBP1 expression after 60 days of corticosterone treatment to roughly half (46%) as compared to the sham-treated group.
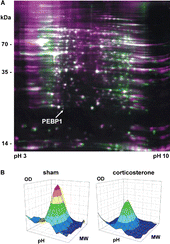
Figure 2 Differential expression of hippocampal proteins after chronic corticosterone. (A) The 2D gel electropherogram shows both spots of the corticosterone group (green) and the sham-treated group (purple) in false-color coding. Overlaid spots appear white. The position of phosphatidylethanolamine binding protein (PEBP1, MW approx. 21 kDa) is indicated by an arrow. (B) Three-dimensional reconstruction of the PEBP1 expression data from the 2D gels show decreased PEBP1 expression after 60 days of corticosterone treatment to roughly half (46%) as compared to the sham-treated group.

Table II.  Differentially expressed proteins in the rat hippocampus after chronic corticosterone treatment.

Figure 3 Functional network mapping of differentially expressed hippocampal proteins after chronic corticosterone. Proteins with expression altered after 60 days of corticosterone treatment were analysed regarding their biological functional network using the IPA (Ingenuity Systems, www.ingenuity.com). The network is displayed as nodes (proteins) and lines (biological relationships between the nodes). Focus proteins which are downregulated under corticosterone treatment are shown in green, proteins upregulated under chronic corticosterone in red. Protein abbreviations can be inferred from . The network contains the phosphatidylethanolamine binding protein-1, PEBP1, and other putative chronic corticosterone target proteins such as calreticulin, CALR, various components associated with synaptic plasticity (internexin alpha, INA; fascin 1, FSCN1; tubulin alpha, TUBA3; glial acidic fibrillary protein, GFAP), as well as metabolic factors (carbonic anhydrase 2, CA2; aldo-keto reductase family 1 member A1, AKR1A1; mitochondrial H+-transporting ATPase F1 alpha isoform 1, ATP5A1, and beta isoform, ATP5B, as well as H+-transporting ATPase V1 subunit B isoform 2, ATP6V1B2) and chaperones (heat shock protein 1, HSPD1).
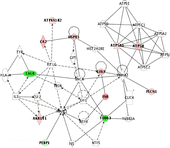
Figure 3 Functional network mapping of differentially expressed hippocampal proteins after chronic corticosterone. Proteins with expression altered after 60 days of corticosterone treatment were analysed regarding their biological functional network using the IPA (Ingenuity Systems, www.ingenuity.com). The network is displayed as nodes (proteins) and lines (biological relationships between the nodes). Focus proteins which are downregulated under corticosterone treatment are shown in green, proteins upregulated under chronic corticosterone in red. Protein abbreviations can be inferred from Table II. The network contains the phosphatidylethanolamine binding protein-1, PEBP1, and other putative chronic corticosterone target proteins such as calreticulin, CALR, various components associated with synaptic plasticity (internexin alpha, INA; fascin 1, FSCN1; tubulin alpha, TUBA3; glial acidic fibrillary protein, GFAP), as well as metabolic factors (carbonic anhydrase 2, CA2; aldo-keto reductase family 1 member A1, AKR1A1; mitochondrial H+-transporting ATPase F1 alpha isoform 1, ATP5A1, and beta isoform, ATP5B, as well as H+-transporting ATPase V1 subunit B isoform 2, ATP6V1B2) and chaperones (heat shock protein 1, HSPD1).

Figure 4 Western blot analysis of PEBP1 expression in the rat hippocampus after 60 days of corticosterone treatment. (A) The panel shows the relative quantification of PEBP1 expression in sham- and corticosterone-treated rats in arbitrary units (a.u.; n = 7). Bars above the mean show the standard deviation. Of note, the largest PEBP1 expression value in the corticosterone group is only slightly greater than the smallest expression value in the sham-treated group. (B) Original gel image obtained by western blotting of the lysates and respective levels of a housekeeping protein. A single PEBP1 band is located at about 22 kDa.
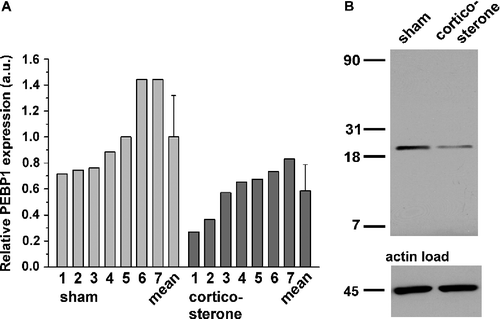
Figure 4 Western blot analysis of PEBP1 expression in the rat hippocampus after 60 days of corticosterone treatment. (A) The panel shows the relative quantification of PEBP1 expression in sham- and corticosterone-treated rats in arbitrary units (a.u.; n = 7). Bars above the mean show the standard deviation. Of note, the largest PEBP1 expression value in the corticosterone group is only slightly greater than the smallest expression value in the sham-treated group. (B) Original gel image obtained by western blotting of the lysates and respective levels of a housekeeping protein. A single PEBP1 band is located at about 22 kDa.

Figure 5 Model of PEBP1 as a mediator in adaptive chronic glucocorticoid-induced response of the brain. Via long-term (acetylcholine) system fatigue upon chronic corticosterone impact, a septo-hippocampal system (SHS) negative override can occur. This results in impaired function over time (right branch). Its feed-forward contributes to the inhibition of several transmitter systems in the hippocampus (black box) leading to circuit defects and reduction of hippocampus-sensitive memory capacities. An alternative transformation function may include regulation of PEBP1 (HCNP) expression, possibly acting together with stem cell proliferation and neurogenesis (NG) to influence circuit integrity. In parallel, PEBP1 inhibition may result from glutamate excitotoxicity and subsequent effects of reactive oxygen species (ROS) (middle branch). Likely, PEBP1 expression is regulated on the levels of the genome, proteome and physiome, i.e. integrated biological function, and makes up only one component of a dynamic response variability that includes manifold interactions with different stages of response to chronic corticosterone (or stress). Question marks indicate unclear relations,+/ − signs stimulatory/inhibitory effects.
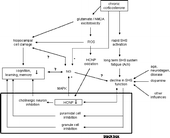
Figure 5 Model of PEBP1 as a mediator in adaptive chronic glucocorticoid-induced response of the brain. Via long-term (acetylcholine) system fatigue upon chronic corticosterone impact, a septo-hippocampal system (SHS) negative override can occur. This results in impaired function over time (right branch). Its feed-forward contributes to the inhibition of several transmitter systems in the hippocampus (black box) leading to circuit defects and reduction of hippocampus-sensitive memory capacities. An alternative transformation function may include regulation of PEBP1 (HCNP) expression, possibly acting together with stem cell proliferation and neurogenesis (NG) to influence circuit integrity. In parallel, PEBP1 inhibition may result from glutamate excitotoxicity and subsequent effects of reactive oxygen species (ROS) (middle branch). Likely, PEBP1 expression is regulated on the levels of the genome, proteome and physiome, i.e. integrated biological function, and makes up only one component of a dynamic response variability that includes manifold interactions with different stages of response to chronic corticosterone (or stress). Question marks indicate unclear relations,+/ − signs stimulatory/inhibitory effects.

Reprints and Corporate Permissions

Please note: Selecting permissions does not provide access to the full text of the article, please see our help page How do I view content?

To request a reprint or corporate permissions for this article, please click on the relevant link below:

Academic Permissions

Please note: Selecting permissions does not provide access to the full text of the article, please see our help page How do I view content?

Obtain permissions instantly via Rightslink by clicking on the button below:

If you are unable to obtain permissions via Rightslink, please complete and submit this Permissions form. For more information, please visit our Permissions help page.