9,349
Views
3
CrossRef citations to date
0
Altmetric
Review Article

Endogenous markers for kidney function in children: a review

, &
Pages 163-183 | Received 15 Nov 2017, Accepted 08 Jan 2018, Published online: 01 Feb 2018

Figures & data

Figure 1. Development of GFR with age. Presentation of 5th and 95th percentile of GFR measured by inulin clearance in healthy children. Data derived from Brodehl et al. [Citation4].

Figure 1. Development of GFR with age. Presentation of 5th and 95th percentile of GFR measured by inulin clearance in healthy children. Data derived from Brodehl et al. [Citation4].

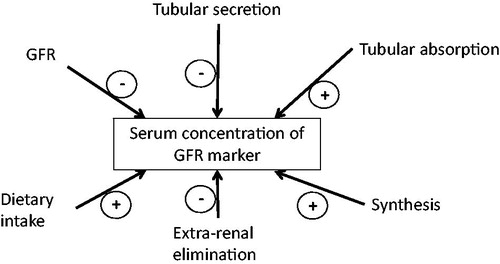
Figure 2. Factors influencing serum concentrations of endogenous eGFR markers.

Figure 2. Factors influencing serum concentrations of endogenous eGFR markers.

Table 1. Characteristics of endogenous marker for kidney function.

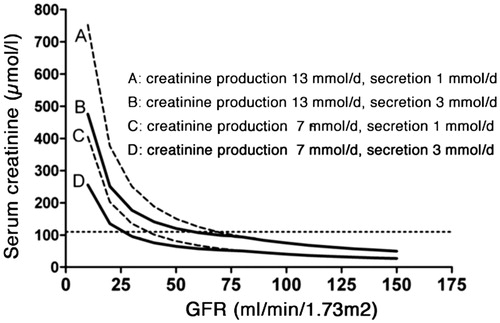
Figure 3. Serum creatinine versus GFR for different rates of creatinine production and tubular secretion. By courtesy of Professor Jack F. M. Wetzels, Nijmegen (modified).

Figure 3. Serum creatinine versus GFR for different rates of creatinine production and tubular secretion. By courtesy of Professor Jack F. M. Wetzels, Nijmegen (modified).

Figure 4. Model of changes in serum creatinine. Acute decrease in GFR by 25, 50 or 75% at 24 h. (a) baseline GFR 100 mL/min/1.73 m2, (b) baseline GFR 50 mL/min/1.73 m2. From Slort et al. [Citation30], used with permission.

Figure 4. Model of changes in serum creatinine. Acute decrease in GFR by 25, 50 or 75% at 24 h. (a) baseline GFR 100 mL/min/1.73 m2, (b) baseline GFR 50 mL/min/1.73 m2. From Slort et al. [Citation30], used with permission.

Figure 5. Serum creatinine versus age. Data from Bökenkamp et al. [Citation43], used with permission.

Figure 5. Serum creatinine versus age. Data from Bökenkamp et al. [Citation43], used with permission.

Figure 6. Serum cystatin C versus age. Grey area indicates reference range (DAKO PETIA, calibration 1998) First published by Data from Bökenkamp et al. [Citation43], used with permission.

Figure 6. Serum cystatin C versus age. Grey area indicates reference range (DAKO PETIA, calibration 1998) First published by Data from Bökenkamp et al. [Citation43], used with permission.

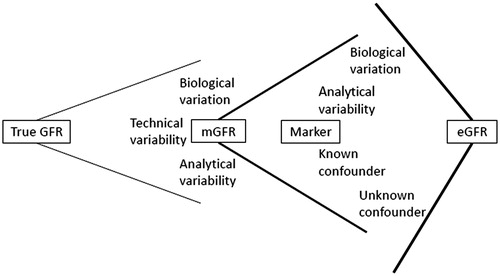
Figure 7. Relationship between true GFR, measured GFR, marker concentration and estimated GFR.

Figure 7. Relationship between true GFR, measured GFR, marker concentration and estimated GFR.

Table 2. eGFR Equations based on different endogenous markers.