Figures & data
Figure 1. Diagrammatic representation of the processes of risk assessment and its relationship to risk management. Communication between the assessors and managers (dashed arrows) and the iterative nature of the process is also illustrated (modified from USEPA Citation1992).
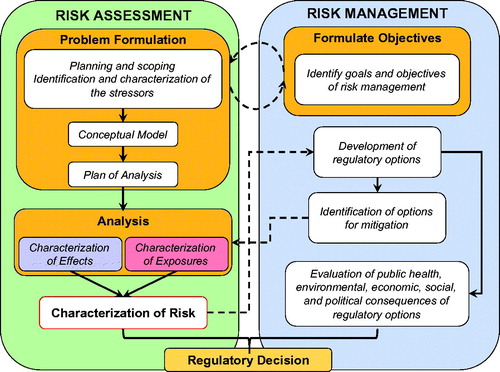
Figure 2. Schematic representation and description of the steps involved in PF for CRA, including the “gatekeeper” step.
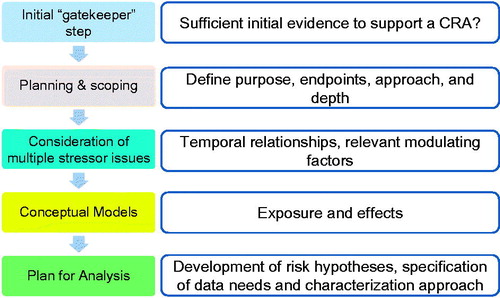
Figure 3. Diagrammatic representation of temporal differences in exposures and how these may interact with persistence of the stressor in the organism and/or latency of response or length of recovery from the stressor. Examples: (A) a mixture of a carbamate and organophosphorus insecticides, (B) an organophosphorus insecticide followed by a carbamate and (C) a carbamate followed by an organophosphorus insecticide. While this representation may not apply to apical end-points, it may help understanding and visually describing the need for CRA when an intermediate KE occurs, although, when considering an individual compound, no clear apical effect is observed. In the example provided, AChE can be inhibited at subthreshold levels by each individual compound, but, depending on timing, the threshold can be reached (overcome) after combined exposure. Heavy black lines – exposure; shaded areas – response.
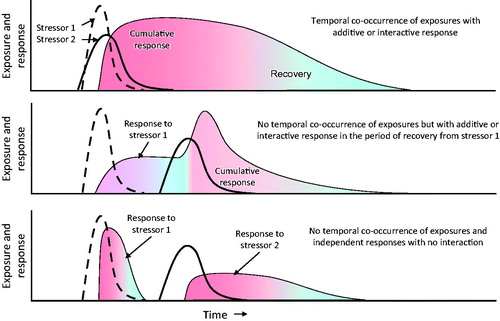
Table 1. Modulating factors.
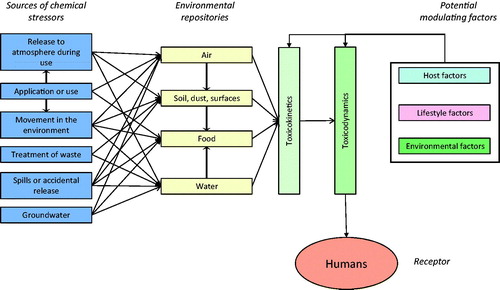
Figure 4. Generic conceptual model for cumulative risk.