
Figures & data
Table 1. Nasal tumor incidence in formaldehyde inhalation studies.
Figure 1. Rat nasal passages, tumor response, and dosimetry. (A) Diagrams of rodent nasal cavity demonstrating prominent bone structures and epithelial lining of the rat nasal cavity (adapted from Alvites et al. 2018). Diagram of the various Levels (I–IV) of the sagittal section of the rat nasal cavity (adapted from Kerns et al. Citation1983). The lower portion shows coronal sections at LI, LII and LIII, where the white represents air passages (meatuses) including the lateral meatus (L) and medial meatus (MM); the black represents bone (lined by epithelium), with nasal turbinates (N), maxilloturbinates (MT) and septum (S) (adapted from Harkema et al. Citation2006; reprinted by Permission of SAGE Publications, Inc.). The red circle at LII corresponds to the tumor shown in C, whereas the shaded blue region corresponds to the CFD flux estimates in D. (B) Dose-response for nasal tumors two animal bioassays (data adapted from U.S. EPA (Citation2010)). Green vertical line represents the dose (ppm) at which formaldehyde would increase tumor “extra risk” by 10% (data plotted using BMDS v3.1). (C) H&E stained early squamous cell carcinoma (arrow) arising from the nasoturbinates of a rat exposed to 15 ppm formaldehyde (adapted from Swenberg et al. Citation1980). The red circle corresponds to the red circle in A. (D) Map of simulated formaldehyde flux along airway walls based on CFD modeling in rat nose (coronal section) at 252 ml/min airflow (reprinted from Kimbell et al. (Citation1993) with permission from Elsevier). M: maximum mass flux at walls.
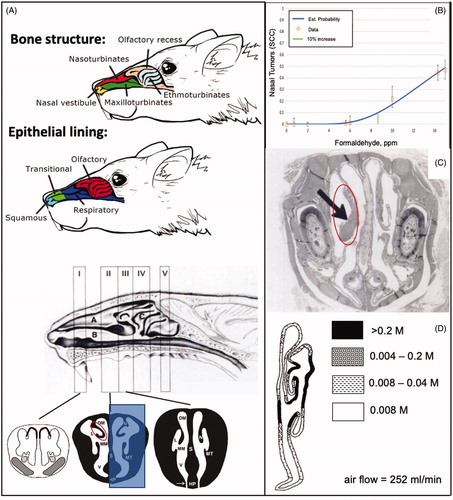
Figure 2. Mapping of regions of various effects of formaldehyde exposure and tissue collection regions. The percentage of nasal SCC in the rat cancer bioassays are shown on the left and color coded to the levels and anatomical regions (left air passage) shown in the middle diagram. Tissue harvest locations from select studies are listed on the right along with color coding to the levels and anatomical regions (right nasal passage) shown in the middle diagram. The shaded blue trapezoid region corresponds to tissue harvested for select assays listed on the right. Diagram of the sagittal section of the rat nasal cavity and coronal sections are adapted from Kerns et al. (Citation1983) and Harkema et al. (Citation2006), (reprinted by Permission of SAGE Publications, Inc.) respectively. See legend of for acronyms. Note: these color codings are interpretations by the authors based on the reported data and are for illustrative purposes only.
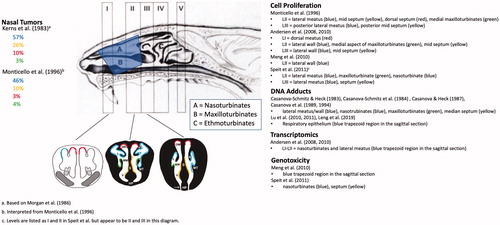
Figure 3. Cell proliferation in rat nasal tissue following subchronic and chronic inhalation exposure to formaldehyde. (A) Unit length labeling index in various regions of the nasal cavity following inhalation exposure to 0.7–15 ppm formaldehyde for 3–18 months (administration of [3H]thymidine by osmotic pumps). Data from Monticello et al. (Citation1996). (B) Unit length labeling index in various regions of the nasal cavity following inhalation exposure to 0.7–15 ppm formaldehyde for 1–42 days (administration of [3H]thymidine by i.p. injection). Data from Monticello et al. (Citation1991). ALM: anterior lateral meatus; PLM: posterior lateral meatus; AMS: anterior mid-septum; PMS: posterior mid-septum; MMX: medial maxilloturbinate.
![Figure 3. Cell proliferation in rat nasal tissue following subchronic and chronic inhalation exposure to formaldehyde. (A) Unit length labeling index in various regions of the nasal cavity following inhalation exposure to 0.7–15 ppm formaldehyde for 3–18 months (administration of [3H]thymidine by osmotic pumps). Data from Monticello et al. (Citation1996). (B) Unit length labeling index in various regions of the nasal cavity following inhalation exposure to 0.7–15 ppm formaldehyde for 1–42 days (administration of [3H]thymidine by i.p. injection). Data from Monticello et al. (Citation1991). ALM: anterior lateral meatus; PLM: posterior lateral meatus; AMS: anterior mid-septum; PMS: posterior mid-septum; MMX: medial maxilloturbinate.](/cms/asset/3ab408e8-7bdf-4923-ae11-af1d4dd831bd/itxc_a_1854679_f0003_c.jpg)
Figure 4. Diagram of formaldehyde metabolism and select adduct formation. See text for various acronyms. Cofactors such oxidized and reduced nicotinamide adenine dinucleotide (NAD+ and NADH) are not shown for simplicity. Formaldehyde is shown crosslinking deoxyguanine (dG) and the cysteine in the tripeptide GSH as an example of relatively stable -N-Me-S- formaldehyde linkages that form between DNA and proteins (DPC). Such DPC have been shown to undergo hydrolysis to HmdG. Examples of mass differences between exogenous (m/z = 285.2) and endogenous (m/z = 282.2) HmdG (in box), which can also undergo hydrolysis back to dG. The mM levels of formaldehyde and GSH are from Andersen et al. (Citation2010).
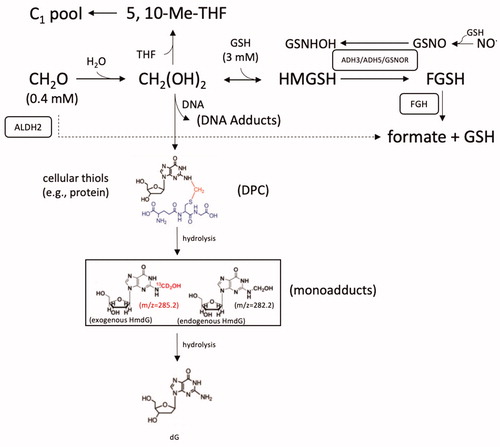
Table 2. Estimated nasal tissue dose in rats.
Figure 5. Summary of formaldehyde-DNA and formaldehyde-protein adducts following inhalation exposure to formaldehyde. Studies show the progression of exposure technology from unlabeled-formaldehyde to dual heavy isotope [13CD2]-formaldehyde, and progression of analytical technology from liquid scintillation counting (LSC) to HPLC technologies, mass spectrometry technologies and most recently to nano-LC-MS/MS methods following inhalation exposure to formaldehyde. Note: Casanova & Heck (Citation1987) exposed rats after pretreatment with corn oil (+GSH) or the GSH inhibitor phorone (−GSH). Open symbols represent doses where DPC or related adducts were not observed at experimental concentrations. Triangles represent non-human primates (all other data are in rats). Dotted line represents 0.3 ppm.
![Figure 5. Summary of formaldehyde-DNA and formaldehyde-protein adducts following inhalation exposure to formaldehyde. Studies show the progression of exposure technology from unlabeled-formaldehyde to dual heavy isotope [13CD2]-formaldehyde, and progression of analytical technology from liquid scintillation counting (LSC) to HPLC technologies, mass spectrometry technologies and most recently to nano-LC-MS/MS methods following inhalation exposure to formaldehyde. Note: Casanova & Heck (Citation1987) exposed rats after pretreatment with corn oil (+GSH) or the GSH inhibitor phorone (−GSH). Open symbols represent doses where DPC or related adducts were not observed at experimental concentrations. Triangles represent non-human primates (all other data are in rats). Dotted line represents 0.3 ppm.](/cms/asset/94599aea-11a8-4aeb-92c9-bd49fdf1bd1a/itxc_a_1854679_f0005_b.jpg)
Figure 6. Measures of endogenous and exogenous DNA adducts. (A) HmdG in nasal tissue of rats exposed to various concentrations of formaldehyde [13CD2]-formaldehyde. Filled black circles indicate HmdG levels after 6 h exposure to 0.7, 2, 6, 10, and 15 ppm [13CD2]-formaldehyde. Red triangles represent exogenous HmdG levels after 28 days of exposure. All other symbols represent HmdG levels after exposure to 2 ppm [13CD2]-formaldehyde for indicated lengths of time. The dotted line indicates the ±1 s.d. range on of endogenous HmdG levels reported in Lu et al. (Citation2010); other data taken from Lu et al. (Citation2011), Yu et al. (Citation2015), and Leng et al. (Citation2019). Exogenous adducts were not detected (ND) at ≤0.3 ppm therefore the adducts levels were set to the limit of detection (LOD). The dotted line indicates the ±1 s.d. range on endogenous adducts. (B) Linear scale plot of the 6 h data (black circles) and 28-day low dose data (red diamonds). The two linear segments in the main plot are the result of segmental linear regression in Prism, which is used here to accentuate the applied concentrations that result in a change in slope (other nonlinear models are not explored here). The inset shows the ratio of exogenous HmdG to endogenous HmdG, with the dashed line indicating unity.
![Figure 6. Measures of endogenous and exogenous DNA adducts. (A) HmdG in nasal tissue of rats exposed to various concentrations of formaldehyde [13CD2]-formaldehyde. Filled black circles indicate HmdG levels after 6 h exposure to 0.7, 2, 6, 10, and 15 ppm [13CD2]-formaldehyde. Red triangles represent exogenous HmdG levels after 28 days of exposure. All other symbols represent HmdG levels after exposure to 2 ppm [13CD2]-formaldehyde for indicated lengths of time. The dotted line indicates the ±1 s.d. range on of endogenous HmdG levels reported in Lu et al. (Citation2010); other data taken from Lu et al. (Citation2011), Yu et al. (Citation2015), and Leng et al. (Citation2019). Exogenous adducts were not detected (ND) at ≤0.3 ppm therefore the adducts levels were set to the limit of detection (LOD). The dotted line indicates the ±1 s.d. range on endogenous adducts. (B) Linear scale plot of the 6 h data (black circles) and 28-day low dose data (red diamonds). The two linear segments in the main plot are the result of segmental linear regression in Prism, which is used here to accentuate the applied concentrations that result in a change in slope (other nonlinear models are not explored here). The inset shows the ratio of exogenous HmdG to endogenous HmdG, with the dashed line indicating unity.](/cms/asset/c7764df0-c78b-4235-a377-a14217f381da/itxc_a_1854679_f0006_c.jpg)
Table 3. In vivo genotoxicity studies on formaldehyde.
Figure 7. ADH5 null mice. (A) Mutant frequency in Big Blue® (WT) mice and ADH5/GSNOR deficient Big Blue® mice (GSNOR−/−). Adapted from Leung et al. (Citation2013). (B) Mice deficient in ADH exhibit higher levels of endogenous HmdG in multiple tissues. Adapted from Pontel et al. (Citation2015). Data were extracted from published figures with WebPlotDigitizer 4.3.
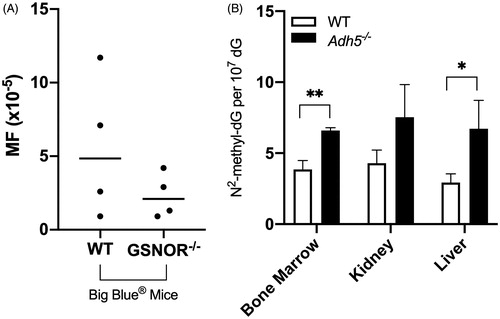
Figure 8. MOA for SCC in the rodent nasal cavity. KE1: saturation of formaldehyde metabolism results in increased free formaldehyde which increases adduction to cellular molecules (e.g. protein, DNA). KE2: increased adduction leads to irritation and cytotoxicity (KE2a) and/or DNA damage (KE2b). KE3: squamous metaplasia is an adaptive response that can be reversible if exposure ceases or decreases (e.g. ≤1 ppm for formaldehyde), can persist if the metaplasia protects against continued exposure (e.g. 2–6 ppm for formaldehyde), or can be overwhelmed if higher exposures (e.g. ≥6 ppm for formaldehyde) exceed protection afforded by squamous epithelium. KE4: continued exposure to cytotoxic concentrations (after adaptive metaplasia has occurred) leads to chronic cell proliferation. KE5: increased cell replication and potentially increased DNA damage increase mutations during replication. The blue “X” indicates that data published after McGregor et al. (Citation2006) do not support a direct contribution from formaldehyde-induced DNA lesions (see text).
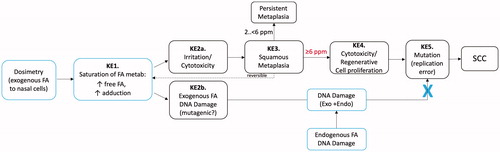
Table 4. Proposed MOA for formaldehyde-induced nasal tumors.
Table 5. Summary of metaplasia in nasal cavity of rats in LI-III.
Table 6. Dose and temporal concordance table.
Table 7. Human relevance.