Figures & data
Table 1. Overview of thyroid-related AOPs including neurodevelopmental outcomes in mammals in the AOP Wiki (as per 16 October 2020).
Table 2. Measurements of triiodothyronine, thyroxine or thyroid stimulating hormone in standard rodent toxicity studies.
Table 3. Neurological and neurodevelopmental parameters included in standard rodent toxicity studies.
Figure 4. Free T4 and tT4 reference ranges for humans (males, pregnant women, infants) as compared to tT4 normal distribution for Wistar rats (males, lactating dams, pups): Ranges from median to 2.5th percentile, relative to the median. fT4: free thyroxine; GD: gestational day; LD: lactational day; N: number of individuals; Trim: trimester; tT4: total thyroxine. Colour legend: grey columns: human fT4 data; striped columns: human tT4 data; black columns: rat tT4 data. Note that T4 variation only attains -50% as compared to TSH variation attaining up to 210% (). Age/life stages (number of individuals): human males: 20–39 years (fT4/tT4: N = 286/130); Wistar rat males: 20 weeks (N = 486); pregnant women: 1st trimester (fT4/tT4: N = 418/417) and 3rd trimester (fT4/tT4: N = 169/169); Wistar rat dams: GD20 (N = 368) LD14 (N = 56); infants: 6 days to 3 months (fT4/tT4: N = 111/99); children: 1–6 years (fT4/tT4: N = 344/341); Wistar rat pups: postnatal day 13 (males/females: N = 398/399). The human fT4/tT4 reference ranges were taken from Roche (Citation2009). The rat normal tT4 distribution ranges were measured in control rats at BASF SE, Ludwigshafen (Germany); see Supplementary Information SI-2 for methodological details and absolute data.
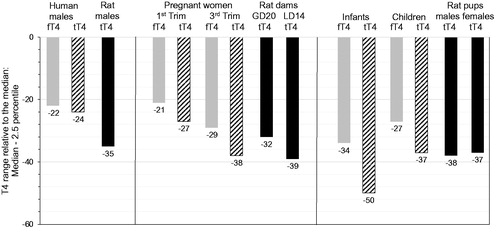
Figure 1. Reasonably detectable T4 and TSH level change [%] – dependent on group size. The percent T4 and TSH level change that is expected to be significant (and hence “reasonably detectable”) is shown for different group sizes. It is presumed that the concurrent control group and the treatment groups have the same maximal allowed coefficient of variation (CV) as per OECD TG 407 (25% for T3/T4 and 35% for TSH); statistical analysis: two-sided Wilcoxon test, power 75%; p < 0.05; software NQUERY.
![Figure 1. Reasonably detectable T4 and TSH level change [%] – dependent on group size. The percent T4 and TSH level change that is expected to be significant (and hence “reasonably detectable”) is shown for different group sizes. It is presumed that the concurrent control group and the treatment groups have the same maximal allowed coefficient of variation (CV) as per OECD TG 407 (25% for T3/T4 and 35% for TSH); statistical analysis: two-sided Wilcoxon test, power 75%; p < 0.05; software NQUERY.](/cms/asset/dc3ce0e3-ec49-4f29-8862-b97f308e5e6d/itxc_a_1910625_f0001_b.jpg)
Figure 2. Reasonably detectable T4 and TSH level change [%] – dependent on coefficient of variation (CV). The percent T4 and TSH level change that is expected to be significant (and hence “reasonably detectable”) assuming group sizes of N = 10 (for both the concurrent control group and the treatment group) was calculated using the formula p = effect size × CV, where p = percent decrease and effect size for N = 10 is 1.406. Statistical analysis: two-sided Wilcoxon test, power 75%; p < 0.05; software NQUERY); see Li et al. (Citation2019) for further details.
![Figure 2. Reasonably detectable T4 and TSH level change [%] – dependent on coefficient of variation (CV). The percent T4 and TSH level change that is expected to be significant (and hence “reasonably detectable”) assuming group sizes of N = 10 (for both the concurrent control group and the treatment group) was calculated using the formula p = effect size × CV, where p = percent decrease and effect size for N = 10 is 1.406. Statistical analysis: two-sided Wilcoxon test, power 75%; p < 0.05; software NQUERY); see Li et al. (Citation2019) for further details.](/cms/asset/a4dd6c5f-0d41-4fd9-a336-e6307459c6f5/itxc_a_1910625_f0002_b.jpg)
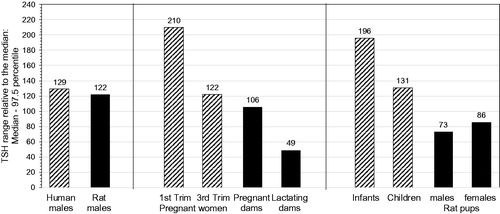
Figure 3. TSH reference ranges for humans (males, pregnant women, infants) compared to TSH normal distributions for Wistar rats (males, lactating dams, pups): Ranges from median to 97.5th percentile, relative to the median. GD: gestational day; LD: lactational day; N: number of individuals; Trim: trimester; TSH: thyroid stimulating hormone. Colour legend: Striped columns: human data; black columns: rat data. Note that TSH variation attains up to 210% as compared to T4 variation attaining only -50% (). Numbers of individuals; age/life stages: Human males: 20–39 years (N = 286); Wistar rat males: 20 weeks (N = 304); pregnant women: 1st trimester (N = 418) and 3rd trimester (N = 170); Wistar rat dams: GD20 (N = 364) and LD14 (N = 48); infants: 6 days to 3 months (N = 119); children: 1–6 years (N = 346); Wistar rat pups: postnatal day 13 (males/females: N = 222/222). The human TSH reference ranges were adapted from Roche (Citation2009). The rat normal TSH distribution ranges were measured in control rats at BASF SE, Ludwigshafen (Germany); see Supplementary Information SI-2 for methodological details and absolute data.