1,925
Views
2
CrossRef citations to date
0
Altmetric
Review Articles

A review of mammalian in vivo genotoxicity of hexavalent chromium: implications for oral carcinogenicity risk assessment

ORCID Icon, , , &
Pages 820-849 | Received 05 Jul 2021, Accepted 22 Oct 2021, Published online: 21 Jan 2022

Figures & data

Figure 1. Oral carcinogenicity of Cr(VI). (A) Incidence of diffuse epithelial hyperplasia (DEH) in the duodenum and the combined adenoma/carcinoma (A/C) incidence in the duodenum and jejunum of B6CF1 mice exposed to Cr(VI) in drinking water for 2 years. (B) Incidence of oral tumors (squamous cell carcinoma) in F344 rats exposed to Cr(VI) in drinking water for 2 years. The vertical dotted line in each plot represents the current MCL for total chromium (0.1 ppm). The lowest data points in each plot represent the control group assigned 0.003 ppm, the 95th percentile Cr(VI) concentration in U.S. water sources (see text). The red arrows point to the 1E-6 risk concentration of 0.07 ppb (0.00007 ppm).

Figure 1. Oral carcinogenicity of Cr(VI). (A) Incidence of diffuse epithelial hyperplasia (DEH) in the duodenum and the combined adenoma/carcinoma (A/C) incidence in the duodenum and jejunum of B6CF1 mice exposed to Cr(VI) in drinking water for 2 years. (B) Incidence of oral tumors (squamous cell carcinoma) in F344 rats exposed to Cr(VI) in drinking water for 2 years. The vertical dotted line in each plot represents the current MCL for total chromium (0.1 ppm). The lowest data points in each plot represent the control group assigned 0.003 ppm, the 95th percentile Cr(VI) concentration in U.S. water sources (see text). The red arrows point to the 1E-6 risk concentration of 0.07 ppb (0.00007 ppm).

Table 1. Summary of in vivo mutation assays on Cr(VI).

Figure 2. Chromium dosimetry in the rodent duodenum. (A) Tissue Cr levels in mouse and rat duodenum following exposure to Cr(VI) for 90 days (note: rats were not exposed to 5 ppm Cr(VI)). (B) XRF images from an unstained transverse section of duodenum from a female B6C3F1 mouse exposed to 180 ppm Cr(VI) for 90 days. (Left) full transverse section with chromium (Cr) XRF. (Right) Magnification of the region in the yellow box, with XRF images for calcium (Ca), sulfur (S), and Cr. Signal for Ca and S are contiguous throughout the villus and crypt regions, whereas Cr signal is very high in the villi, but low or absent in the crypt. (C) Chromium XRF image of an unstained 5-µm transverse section from the duodenum of a female F344 rat exposed to 180 ppm Cr(VI) for 90 days. Adapted from Thompson et al. (Citation2011, Citation2015).

Figure 2. Chromium dosimetry in the rodent duodenum. (A) Tissue Cr levels in mouse and rat duodenum following exposure to Cr(VI) for 90 days (note: rats were not exposed to 5 ppm Cr(VI)). (B) XRF images from an unstained transverse section of duodenum from a female B6C3F1 mouse exposed to 180 ppm Cr(VI) for 90 days. (Left) full transverse section with chromium (Cr) XRF. (Right) Magnification of the region in the yellow box, with XRF images for calcium (Ca), sulfur (S), and Cr. Signal for Ca and S are contiguous throughout the villus and crypt regions, whereas Cr signal is very high in the villi, but low or absent in the crypt. (C) Chromium XRF image of an unstained 5-µm transverse section from the duodenum of a female F344 rat exposed to 180 ppm Cr(VI) for 90 days. Adapted from Thompson et al. (Citation2011, Citation2015).

Figure 3. Eye spot test (in vivo mutation) results from Kirpnick-Sobol et al. (Citation2006). Data were extracted from in Kirpnick-Sobol et al. (Citation2006) using WebPlotDigitizer v4.3 and replotted in Prism 9. **p-value < 0.01; ****p-value < 0.0001.

Figure 3. Eye spot test (in vivo mutation) results from Kirpnick-Sobol et al. (Citation2006). Data were extracted from Figure 4 in Kirpnick-Sobol et al. (Citation2006) using WebPlotDigitizer v4.3 and replotted in Prism 9. **p-value < 0.01; ****p-value < 0.0001.

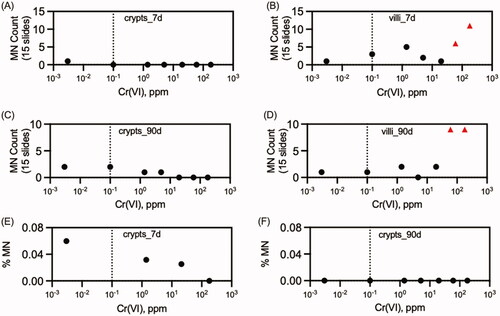
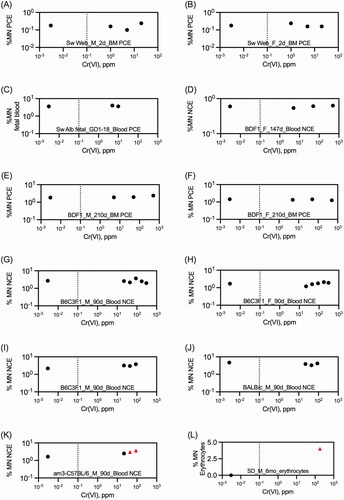
Table 2. Summary of in vivo chromosomal damage assays on Cr(VI).

Table 3. Summary of in vivo DNA damage assays on Cr(VI).

Figure 4. Summary of in vivo Cr(VI) mutation assays employing drinking water exposure. Red triangles indicate data points that differed significantly from concurrent controls. For clarity, variance data have been removed. The dotted line marks the current MCL of 0.1 ppm total Cr. Text on each plot designates the tissue examined, duration of exposure, and gene measured. Source: (A, B): Thompson Young et al. (Citation2015); (C) Thompson et al. (Citation2017); (D) O’Brien et al. (Citation2013); (E,F) Aoki et al. (Citation2019); (G) Kirpnick-Sobel et al. (2006).

Figure 4. Summary of in vivo Cr(VI) mutation assays employing drinking water exposure. Red triangles indicate data points that differed significantly from concurrent controls. For clarity, variance data have been removed. The dotted line marks the current MCL of 0.1 ppm total Cr. Text on each plot designates the tissue examined, duration of exposure, and gene measured. Source: (A, B): Thompson Young et al. (Citation2015); (C) Thompson et al. (Citation2017); (D) O’Brien et al. (Citation2013); (E,F) Aoki et al. (Citation2019); (G) Kirpnick-Sobel et al. (2006).

Figure 5. Summary of in vivo Cr(VI) MN assays in the female B6C3F1 mouse duodenum. Red triangles indicate data points that differed significantly form concurrent controls. For clarity, variance data have been removed. The dotted line marks the current MCL of 0.1 ppm total Cr. Text on each plot designates the tissue examined and duration of exposure. Source: (A, C): EPL (Citation2013); (B, D, F) O’Brien et al. (Citation2013); (E) Thompson et al. (Citation2015).

Figure 5. Summary of in vivo Cr(VI) MN assays in the female B6C3F1 mouse duodenum. Red triangles indicate data points that differed significantly form concurrent controls. For clarity, variance data have been removed. The dotted line marks the current MCL of 0.1 ppm total Cr. Text on each plot designates the tissue examined and duration of exposure. Source: (A, C): EPL (Citation2013); (B, D, F) O’Brien et al. (Citation2013); (E) Thompson et al. (Citation2015).

Figure 6. Summary of in vivo Cr(VI) MN assays in blood and bone marrow drinking water studies. Red triangles indicate data points that differed significantly form concurrent controls. For clarity, variance data have been removed. The dotted line marks the current MCL of 0.1 ppm total Cr. Source: (A-B) Mirsalis et al. (Citation1996); (C–F) De Flora et al. (Citation2006); (G–K) NTP (Citation2007); (L) Elshazly et al. (Citation2016).

Figure 6. Summary of in vivo Cr(VI) MN assays in blood and bone marrow drinking water studies. Red triangles indicate data points that differed significantly form concurrent controls. For clarity, variance data have been removed. The dotted line marks the current MCL of 0.1 ppm total Cr. Source: (A-B) Mirsalis et al. (Citation1996); (C–F) De Flora et al. (Citation2006); (G–K) NTP (Citation2007); (L) Elshazly et al. (Citation2016).