Figures & data
Figure 1. Structures of drugs under study.
Figure 2. Composite dose-response curves in human leukemia cells. Data from replicate dose-response experiments for HL-60 (open circles) and U937 (filled circles) leukemia cell lines were combined and the mean values plotted for the various drugs under study. Line: data fit to the Hill Equation (a form of the median-effect equation); bar: intra-assay standard error.
Table I. Potency of CP-4055 and combination partners in human leukemia cells
Figure 3. Combination index plots of Chou-Talalay and impact of drug sequence in HL-60 cells. Composite dose-response curves were constructed for drugs alone and in combination as described in Methods. The respective fraction affected (Fa) was interpolated at 10 percent Intervals and the values used to compute the combination index for simultaneous administration of CP-4055 (open circles), for CP-4055 given 24 h prior to (open triangles) or 24 h after (open squares) the second drug in the combination listed in each panel. For cytarabine, only simultaneous combinations are shown combined with CP-4055 (closed circles), and with gemcitabine (closed triangles).
Figure 4. Combination index plots of Chou-Talalay and impact of drug sequence in U937 cells. Drug interaction was assessed by the combination index method as described in in U937 cells for the drug combination partners listed in each panel.
Table II. Combination index at the IC50 in human leukemia cells
Table III. Dose reduction index for CP-4055 combined with gemcitabine in HL-60 cells
Figure 5. Effect of ratio on drug interaction in HL-60 cells. 3-Dimensional drug interaction analysis was performed for binary combinations of CP-4055 in HL-60 cells as described in Methods. The combination effect surface is presented as a color-coded contour map where green represents additivity, red antagonism and blue synergy. For clarity, the color spectrum has been constrained to the range −6 to +6. Values beyond those extremes were observed, but not discriminated (i.e. the blue corresponding to CE = 6 actually represents CE ≥ 6).
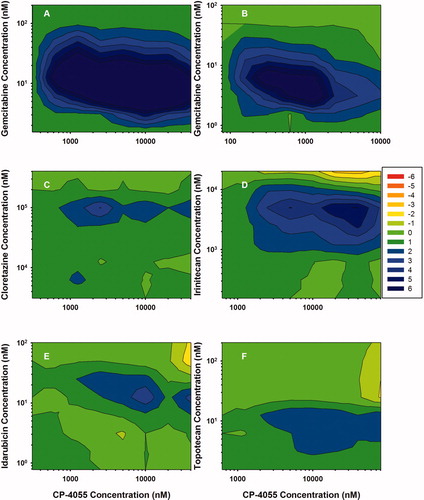
Figure 6. Effect of ratio on drug interaction in U937 cells. 3-Dimensional analysis was performed as in for the same drug combinations but in the U937 cell line.
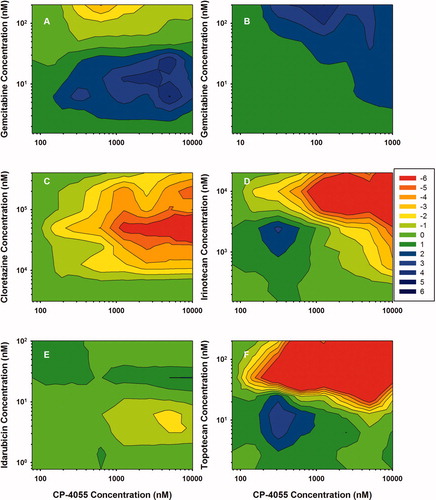
Figure 7. Effect of exposure time on the interaction of CP-4055 plus gemcitabine. Panel A: IC50 versus exposure time in HL-60 cells Is shown for CP-4055 (diamonds) and gemcitablne (triangles) as single agents. Panel B: HL-60 (circles) or U937 (squares) cells were exposed simultaneously to CP-4055 in combination with gemcitabine at a fixed ratio of 1:0.0025 or 1:0.02, respectively. The combination index at the IC50 level of effect was then determined at each indicated time point. Bars: intra-assay standard error; lines: fit of data to the pharmacodynamic model Cn × T = k.
Table IV. Pharmacodynamic model parameters for the simultaneous combination of CP-4055 plus gemcitabine.*
Table V. Reported potency of CP-4055 versus cytarabine