Figures & data
Figure 1. TR-57 induces apoptosis in primary CLL cells and in the OSU-CLL and OSU-CLL-TP53ko cell lines. CLL cell viability was assessed by flow cytometry using DiIC1(5) and PI. Viability is expressed relative to vehicle-treated controls and error bars represent the standard deviation. (A) Primary CLL cells (n = 15 patients), cultured in medium alone or in co-culture with CD40L-fibroblasts, were treated with TR-57 for 48 h. (B) Dose response analysis of TR-57 against TP53 wild-type (n = 8) and TP53 dysfunctional (n = 5) CLL patient samples following 48 h treatment in co-culture with CD40L-fibroblasts. (C) OSU-CLL and OSU-CLL-TP53ko cell lines were treated with TR-57 for 48 h. Data are the mean of 4 biological replicates.
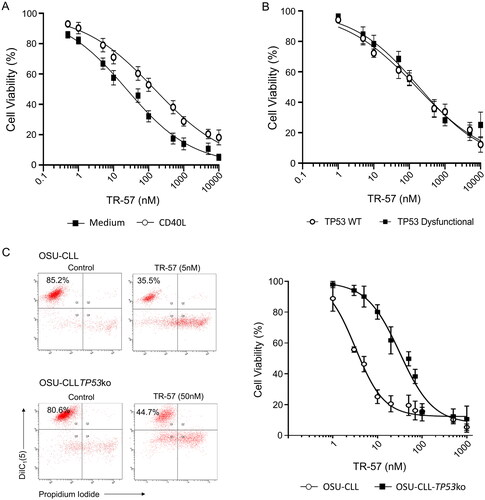
Figure 2. TR-57 and venetoclax are synergistic in their cytotoxic effects toward CLL cells.
Cell viability was assessed by flow cytometry using DiIC1(5) and PI following treatment with TR-57 and venetoclax as single agents and in combination. Drugs were combined at fixed ratios based on IC50 values as single agents. Ratios of TR57: venetoclax were 1:1 for primary CLL cells (A) and the OSU-CLL cell line (B) and 1:10 for the OSU-CLLTP53ko line (C). Synergy was assessed by calculating CI at a range of fractional effects using the CompuSyn software. CI values of >1, 1, and <1 are indicative of antagonism, additivity and synergy, respectively. Dose-response analyses and assessment of synergy in (A) CLL patient samples (n = 15). Representative data from one CLL patient sample is shown. (B) OSU-CLL and (C) OSU-CLL-TP53ko cell lines. Error bars represent the standard deviation. Data in (B) and (C) are the mean of 3 biological replicates.
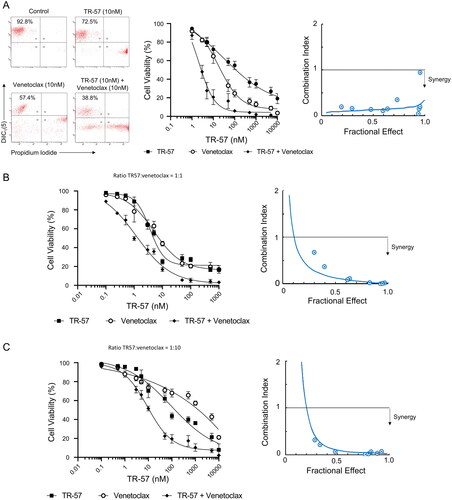
Table 1. Details of CLL patient samples studied.
Figure 3. TR-57 and venetoclax reduce the proliferative and migratory capacity of CLL cells.
(A) Proliferation of the OSU-CLL and OSU-CLL-TP53ko cells was assessed using flow cytometry in cells stained with CFSE. Cells were treated with TR-57 and venetoclax, alone or in combination for 0–72 h (2 and 2 nM and 25 and 250 nM for TR-57 and venetoclax against the OSU-CLL and OSU-CLLTP53ko lines, respectively). (B) Cell cycle analysis by flow cytometry of primary CLL cells (n = 7 patients) following culture in medium alone or stimulation with Dsp30/IL2. The proportion of CLL cells stimulated into S or G2/M phases and the effects of TR-57 and venetoclax, alone or in combination, on the stimulation were assessed. Representative histograms from one patient sample are shown. Data were analyzed using ModFit software. (C) The effects of TR-57 and venetoclax, alone or in combination, on the expression of CD49d (left) and CXCR4 (center) and on the migratory capacity (right) of primary CLL cells from 7 patients were assessed by flow cytometry. Data are expressed as fold-changes relative to cells cultured in medium alone (control). Asterix indicate the following: *p < 0.05, **p < 0.01, and ***p < 0.001.
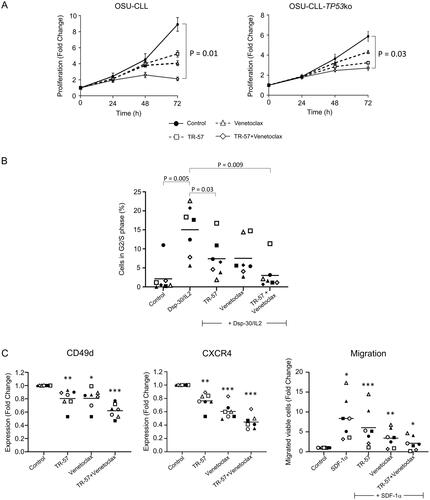
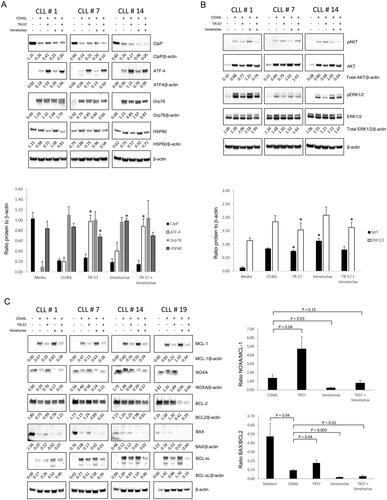
Figure 4. TR-57, alone and in combination with venetoclax, induces changes in proteins involved in the UPR, inhibits AKT and ERK1/2-MAPK signaling, and induces a pro-apoptotic shift in BCL-2 family proteins. Immunoblotting of CLL patient samples, examining changes in (A) UPR-related proteins, CIpP and HSP60, (B) AKT and ERK1/2-MAPK signaling, and (C) BCL-2 family proteins. Primary CLL cells were cultured in medium alone or with CD40L-fibroblasts and were treated either with vehicle, 50 nM TR-57 or venetoclax, as single agents or in combination, for 24 h. The ratios of proteins to β-actin (A and B) or anti-apoptotic BCL-2 proteins (C) are shown under the immunoblots and in the histograms. *indicates p < 0.05 for changes in expression of the UPR or AKT and ERK1/2 proteins relative to CLL cells co-cultured with CD40L-fibroblasts.