
Figures & data
Table 1. Patient, donor, disease and transplant characteristics.
Figure 1. Significant effects of HLA matching differences on CRS and maximum temperature developing after PTCy-alloSCT in patients transplanted with 12/12, 10/10 and 9/10 matched donors.
Horizontal bars show median values.
A) Differences in CRS. P-values indicate differences between groups with combined CRS grade 1 and 2 by Fisher’s exact test.
B) Differences in maximum temperature. Temperatures of 37, 38, 39, 40 and 41°C correspond with 98.6, 100.4, 102.2, 104 and 105.8°F, respectively. P-values indicate differences between groups by Kruskal-Wallis test with pairwise comparisons after Bonferroni correction (global p-value p < 0.001).
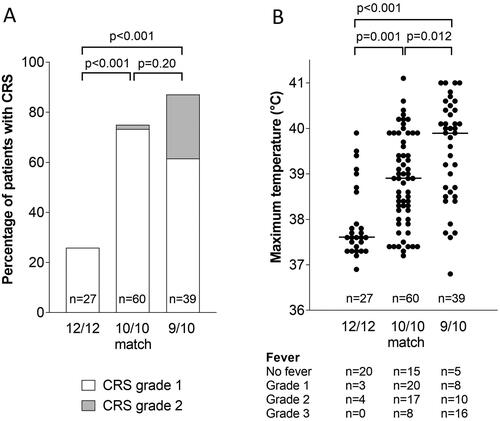
Figure 2. Effects of differences in HLA matching on maximum temperature developing after alloSCT with PTCy.
Temperatures of 37, 38, 39, 40 and 41°C correspond with 98.6, 100.4, 102.2, 104 and 105.8°F, respectively. Horizontal bars show median values. Patients transplanted with 12/12 matched donors are subdivided in RD (related donor) and UD (unrelated donor). Patients transplanted with 10/10 matched donors are subdivided in DP P (HLA-DPB1 permissive mismatch) and DP NP (HLA-DPB1 non-permissive mismatch), two-sided Mann-Whitney shows significant difference between these groups. Patients transplanted with 9/10 matched donors are subdivided according to MM (mismatch) in HLA-A, B, C, DR (DRB1) or DQ (DQB1), Kruskal–Wallis test shows statistical difference within these groups (global p-value = 0.003), post hoc testing with Bonferroni adjustment shows significant difference between HLA-DRB1 and HLA-C subgroups.
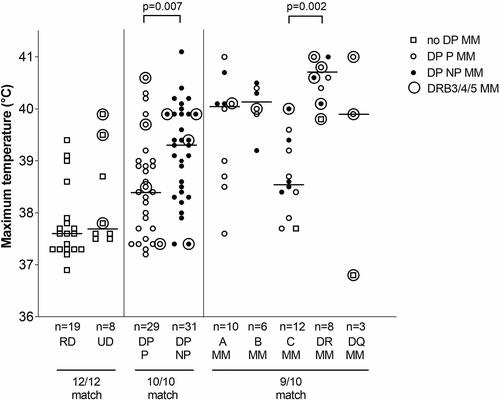
Table 2. Description of patients with non-relapse mortality after PTCy-alloSCT.
Figure 3. Effect of the grade of CRS and maximum grade of fever during CRS on survival and non-relapse mortality (NRM) after PTCy-alloSCT.
Figures A and C show effects of grade of CRS on survival and NRM, figures B and D effects of maximum grade of fever during CRS on survival and NRM. Both for the log-rank test (survival) and for Grays’s test (NRM), global p-values are shown. Also p-values for the comparison of grade 3 fever versus grade 0-2 fever and grade 2 CRS versus grade 0-1 CRS are shown.
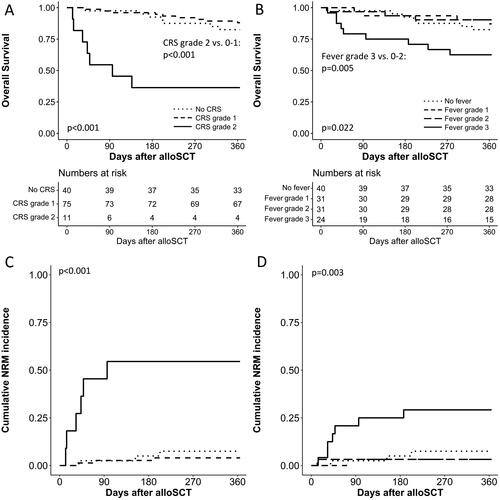
Table 3. Multivariable analysis of overall survival.