Figures & data
Figure 1. Total attack numbers over time (light bars) with negative binomial model (thin line line) overlaid. Labels indicate the statistically significant interventions (modelled over periods shown by the thick line).
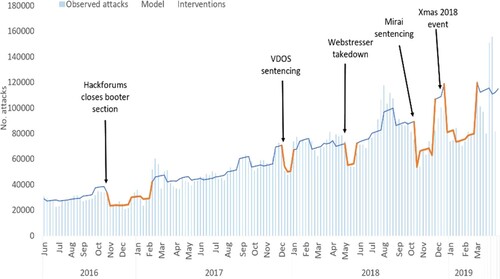
Table 1. List of interventions.
Table 2. Negative binomial regression model showing model composition, including key interventions, seasonal components, first order trend, and constant with significance and effect size.
Table 3. Estimated effect sizes of statistically significant (at the global scale) interventions by country (UK, US, Russia, France, Germany, Poland, and the Netherlands), showing the effects of each intervention component in separate negative binomial models of attack numbers over time in each country.
Figure 2. Stacked area graph showing total number of DoS attacks per week over time as self-reported by booter provider websites. Each stacked area series refers to the attacks reported by an individual booter service – as can be seen, the market structure changes in December 2018, where most of the attacks displace to a single service.
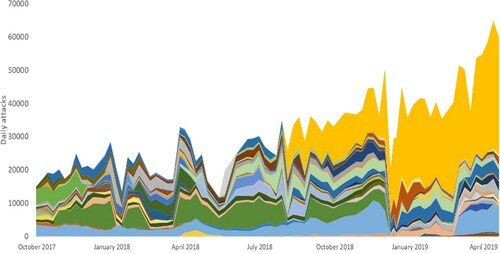
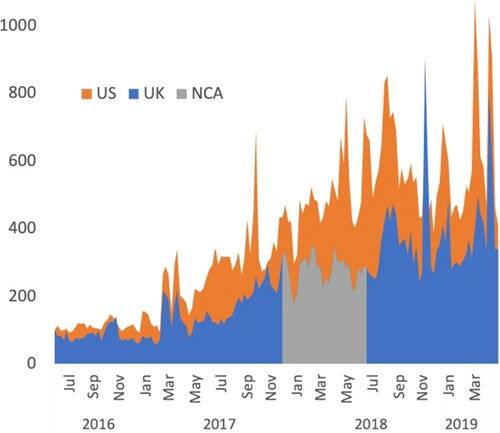
Figure 3. US and UK attack counts comparison. Non-stacked graph with totals scaled so both start at 100 in June 2016, with 200 representing a doubling. The NCA advertising intervention period which affects the UK data is highlighted in grey.