Figures & data
Figure 1. Location of the sampling site.
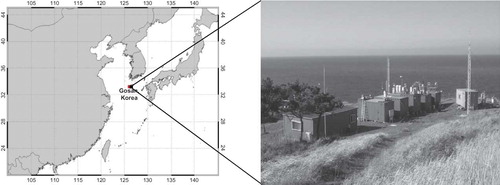
Table 1. Schedule of quality control (QC) activities performed during the intensive measurement period
Figure 2. Temporal variations of carbonaceous aerosol components, wind speed, and wind direction at the Gosan supersite during the summer intensive measurement period of 2009.
Figure 3. Temporal variations of carbonaceous aerosol components, wind speed, and wind direction at the Gosan supersite during the fall intensive measurement period of 2009.
Figure 4. Diurnal variation of the WSOC/OC ratio at Gosan from May 28 to June 17, 2009.
Figure 5. Air mass classification based on the cluster of HYSPLIT back trajectories at the Gosan supersite for the sampling periods of 2009.
Figure 6. The combined MODIS AOD image and 5-day backward trajectories on June 9 (a) and September 25 (b), 2009.
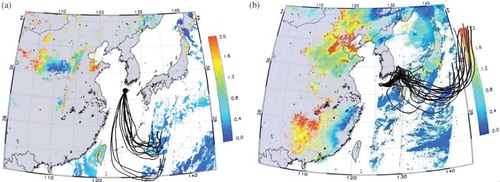
Figure 7. The combined MODIS AOD image and 5-day backward trajectories on June 13 (a) and September 18 (b), 2009.
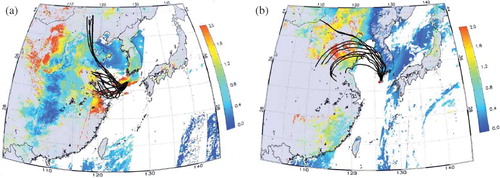
Table 2. Statistics concerning OC, WSOC, WSOC/OC, EC, and OC/EC during the Continental, Marine, East Sea, and Korean Peninsula air mass types
Figure 8. Scatter plots of EC and OC concentrations for different air mass types (CC = dark triangle, M = open square, ES = open circle, KP = asterisk).
Figure 9. Relationship between OC and EC at background and urban sites in Asia.
Table 3. SOC estimation by the EC tracer method during summer and fall seasons
Table 4. Mean SOC (μgC m−3) and SOC/OC (%) at the Gosan supersite during summer and fall in 2009
Figure 10. Relationship between measured WSOC and calculated SOC during continental air flow in summer (dark square) and fall (open circle) seasons.