Figures & data
Figure 1. Data collection method.
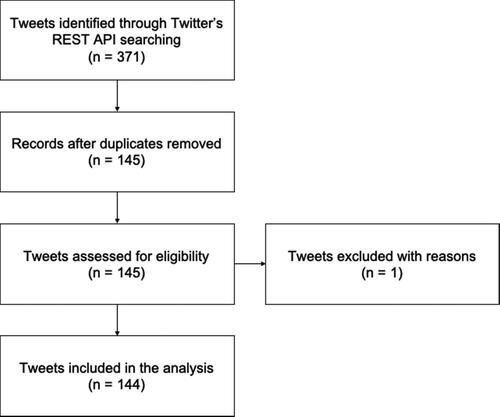
Figure 2. Most frequent words (> 4) observed in the corpus of tweets, excluding the search terms. Note: The words “gambl*” and “addict*,” occurring 174 and 171 times in the corpus, respectively, were removed from the graph to facilitate its interpretation.
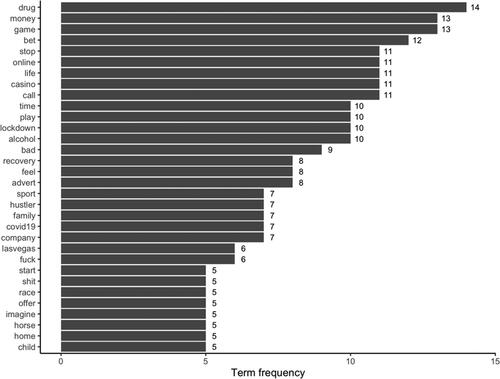
Table 1. Characteristics of tweets (N = 144).
Figure 3. Mean exclusivity computed across k = 99 topic models (2–100). The continuous line represents the smoothed exclusivity curve. The dotted line represents the selected cutoff (5 topics).
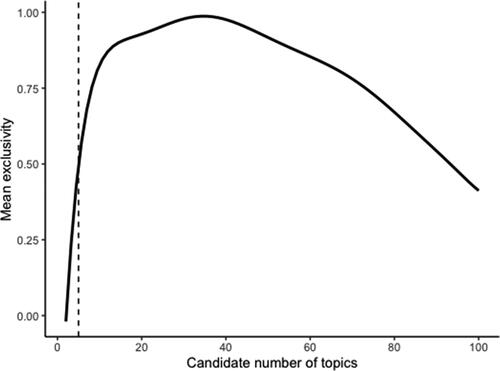
Figure 4. Model of relations between words (bigrams) from the corpus of tweets. The width of the connecting lines is proportional to the frequency of co-occurrences between words (i.e., a thicker line indicates a more frequent word co-occurrence, as in the case of the words “gambling” and “addict”).
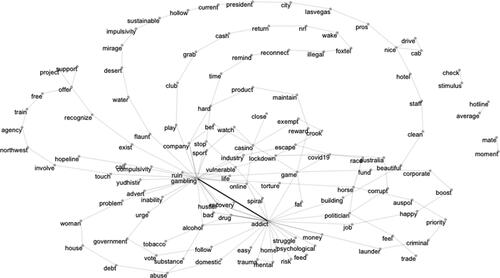
Table 2. Summary of topic modeling.
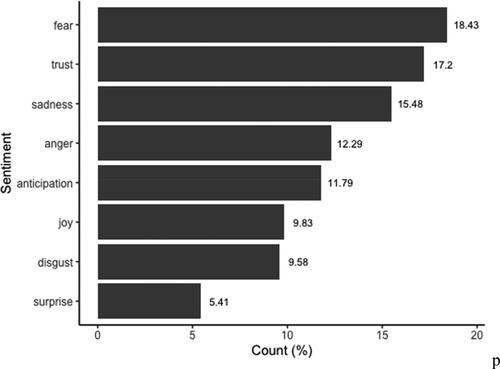
Figure 5. Sentiment analysis based on the whole corpus of tweets.