
Figures & data
Figure 1. Visualization of the data sets and their usage.
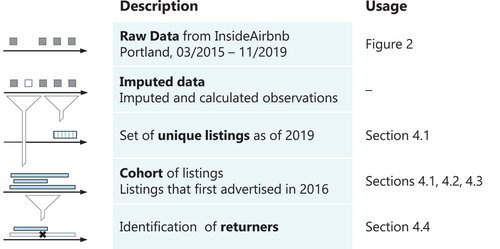
Figure 2. Observations (number of listings) per month.
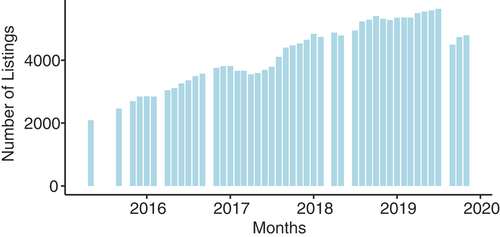
Figure 3. Map of Portland (background image: © OpenStreetMap contributors) with listing locations.
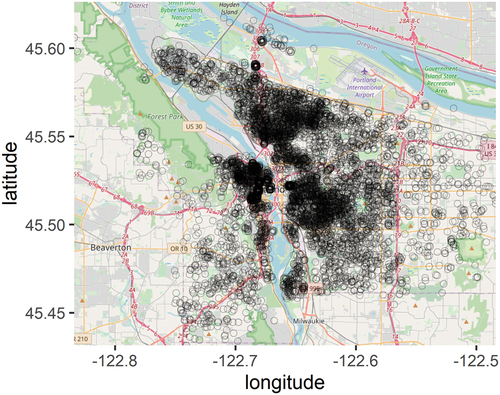
Figure 4. (a) (left). Review scores of Airbnb listings (Portland 2019). (b) (right). Plot of the number of reviews against the review score (Portland 2019).
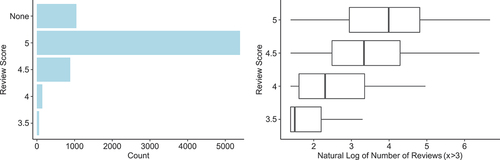
Figure 5. Number of listings by review score (cohort, Portland, 2016–2019).
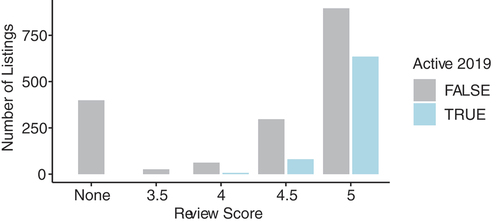
Figure 6. Markov states and transition probabilities of the rating.
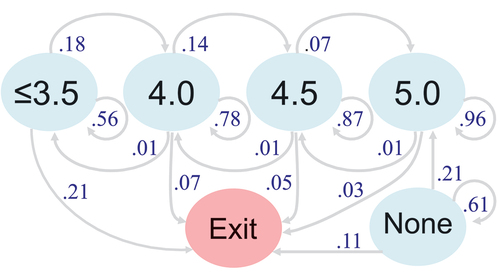
Figure 7. Two-dimensional Markov chain with number of reviews (vertical) and ratings (horizontal).
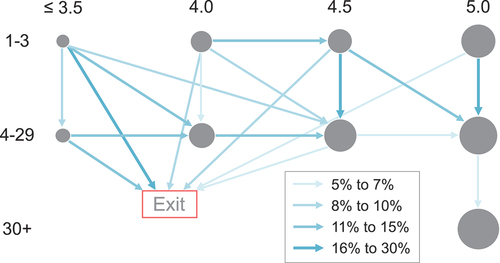
Figure 8. Coefficients of the rating score predicting activity in 2019 (cohort, Portland).
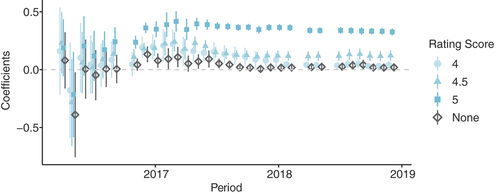
Table A1. Summary statistics of the number of reviews and the review score (internal scale of 20 to 100).
Table A2. Estimating the active persistence (until 2019) of listings.
Data availability statement
The data analyzed throughout this study is available online at http://insideairbnb.com/.