

Figures & data
Figure 1. Flow diagram of the study selection process.
Table 1. Characteristics of included RCT studies.
Figure 2. Bias risk assessment of the RCTs.
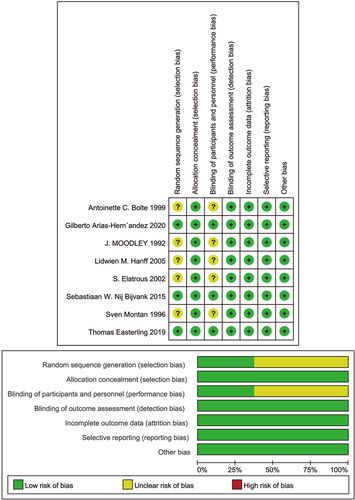
Figure 3. (a) Network plot of eligible comparisons between different strategies. (b) Direct meta-analysis results. Interventions. (c) Network meta-analysis results. Interventions.
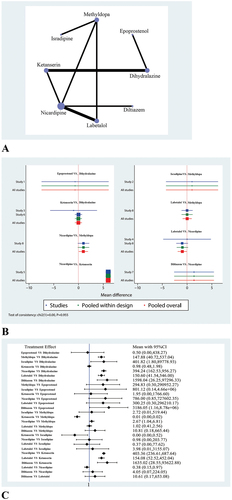
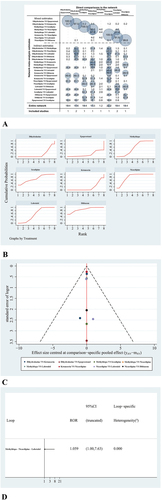
Figure 4. (a) Contribution of DMA and NMA. Interventions.(b) The surface under the cumulative ranking curve (SUCRA). (c) Comparison-adjusted funnel plot (points with different colors represent different interventions). (d) Loop-consistency plot.
Data availability statement
Further inquiries can be directed to the corresponding author/s.
