
Figures & data
Figure 1. Flowchart of the study selection process and results.
Table 1. Baseline characteristics of the included studies.
Figure 2. Forest plots for the meta-analysis of the association between TyG index and new-onset hypertension in general population.
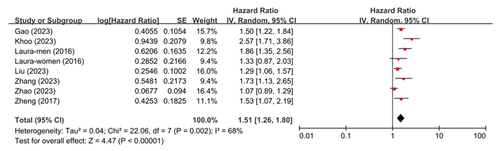
Figure 3. Funnel plots for the meta-analysis of the TyG index and risk of new-onset hypertension.
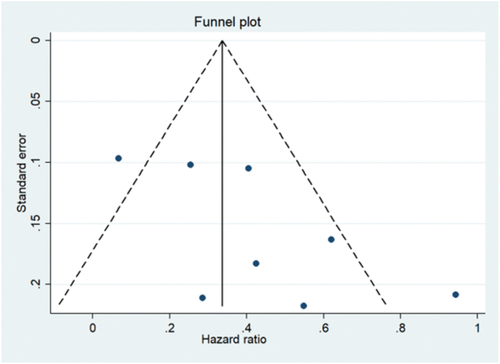
Figure 4. New funnel plot after adding three simulated missing studies.
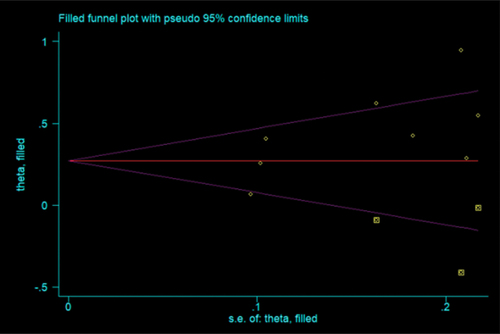
Figure 5. Subgroup analysis for the association between TyG index and new-onset hypertension (a. Subgroup analysis according to the age of the participants b. Subgroup analysis according to the BMI of the participants c. Subgroup analysis according to the follow-up duration).
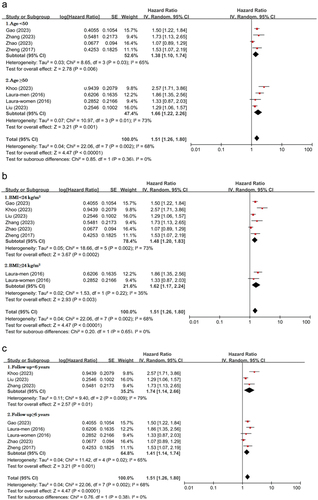
Figure 6. Subgroup analysis for the association between TyG index and new-onset hypertension (D. Subgroup analysis according to the ethnicity of the participants E. Subgroup analysis according to the sex of the participants).
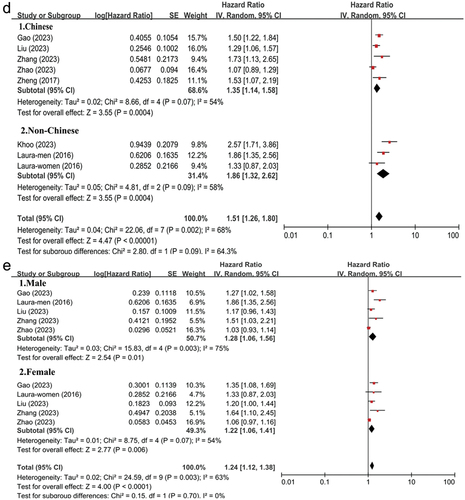
Table 2. Sensitivity analysis of the association between TyG index and new-onset hypertension.