
Figures & data
Table 1. Sample codes and their corresponding electrolyte composition.
Table 2. Ion concentrations of SBF solution.
Figure 1. (a) XRD patterns of NbO containing coating (sample N) in comparison with that of plain PEO coated sample (sample P) and base metal (sample B). (b, c) The water droplet images and contact angles of the sample P and sample B, respectively. (d1, d2) SEM micrograph and 3D optical profile of the sample P, respectively. (e1, e2) SEM micrograph and 3D optical profile of the sample N, respectively.
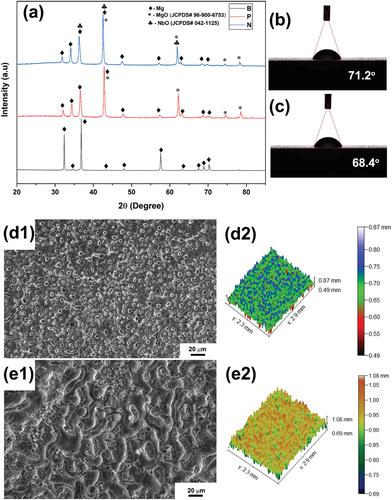
Table 3. Amplitude parameters of roughness profile for samples P and N.
Figure 2. EDS elemental mapping of sample P.
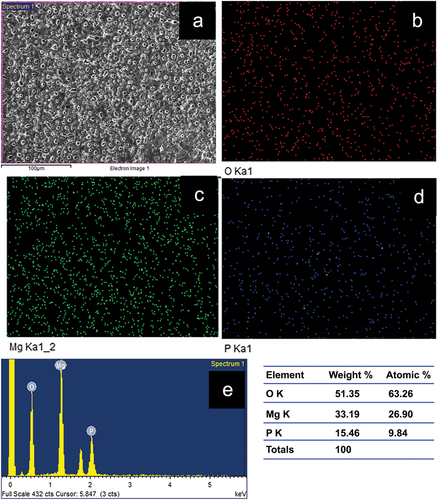
Figure 3. EDS elemental mapping of sample N.
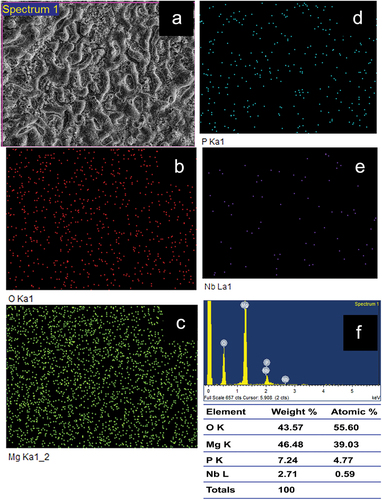
Figure 4. Tafel curves of samples P and N in comparison with that of base metal (B).
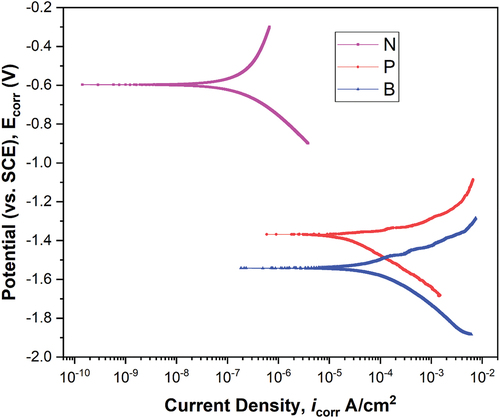
Table 4. Electrochemical parameters of samples B, P and N obtained from Tafel test.
Figure 5. EDS elemental mapping of samples P (P1 through P5) and N (N1 through N6) showing the apatite layer formation after 14 days of immersion in SBF solution.
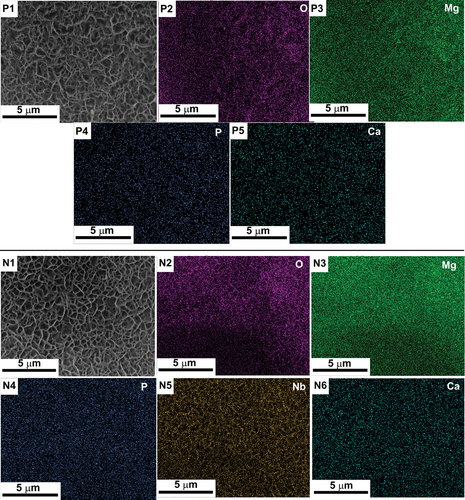
Table 5. Elemental presence in the apatite layer formed on sample P and N after the bioactivity test in SBF solution after 14 days.