Figures & data
Figure 1. Morphology of N1E-115 cells before and after elongation of neurites (A). Ionomycin induces neurite degeneration and cell death in a concentration- and time-dependent manner (B). N1E-115 cells were plated at a density of 1.5 × 10⁵ cell/ml in double-coated 24-well plates. After treatment with each concentration of ionomycin, the number of dead cells was enumerated by trypan blue dye exclusion assay. Phase contrast images of neurites in N1E-115 cells in the presence or absence of ionomycin (C). Arrows indicate beading during degeneration of N1E-115 cells. Proportion of neurite degeneration in N1E-115 cells (D). Neurite degeneration was determined for each concentration and incubation time. A minimum of four wells were used per experiment. Each column represents the mean of at least three independent experiments. A large proportion of the cells became detached from the plates and neurites were lost; thus, some of the high concentration ionomycin-treated samples could not be enumerated (described as “Not enumerate”). Data were analyzed using a Student’s t-test, *indicates p < .05, and **indicates p < .01.
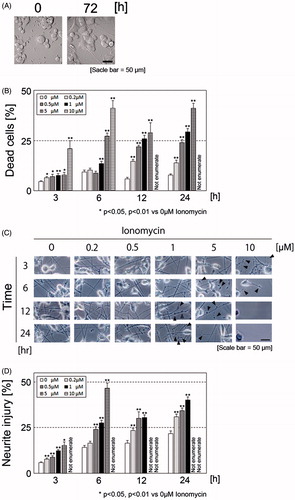
Figure 2. Ionomycin induces calcium influx in N1E-115 cells. The relative intensity of Fluo-4 AM emissions is shown in the presence or absence of ionomycin (A). Black boxes and white circles indicate control and ionomycin-treated cells, respectively. Fluorescence emissions before the start of incubation in each cell were set to 1. Images were taken using a time-lapse live cell imaging system (B). Images in B are shown as merged fluorescence- and bright-field images. Images in C are shown as fluorescence- and bright-field images at high magnification. Arrows show fluorescence emissions of neurite regions. One experiment per dish was set to at least four different fields and recorded every 2 min over 3 h. Each column represents the mean of four independent experiments. Data were analyzed using one-way ANOVA, **indicates p < .01 compared with control.
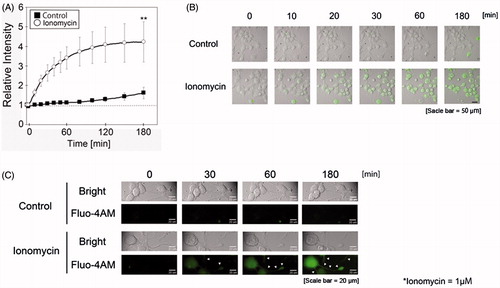
Figure 3. Ionomycin induces ROS production in N1E-115 cells. Relative intensities of MitoSOXTM emissions are shown in the presence or absence of ionomycin (A). White circles and black boxes indicate ionomycin-treated cells and controls, respectively. Fluorescence emissions before the start of incubation in each cell were set to 1. Images were taken using a time-lapse live cell imaging system (B). Localization of mitochondria was determined using Mitotracker® (C). Images in B and C are shown as merged fluorescence- and bright-field images. One experiment per dish was set to at least four different fields and recorded every 10 min for 3 h. The figure shows up to 3-h incubation. Each column represents the mean of four independent experiments. Data were analyzed using a one-way ANOVA, **indicates p < .01 compared with control.
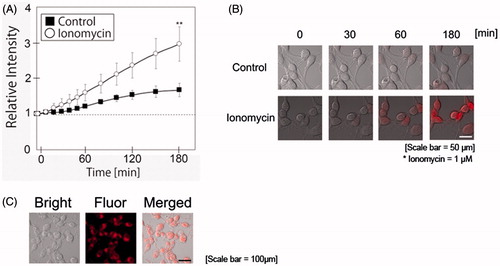
Figure 4. Ionomycin induces mitochondrial lipid peroxidation in N1E-115 cells. One experiment per dish was set to at least four different fields and recorded every 2 min for 3 h. The relative intensities of MitoPeDPP emissions are shown in the presence or absence of ionomycin (A). White circles and black boxes show ionomycin-treated cells and controls, respectively. Fluorescence emissions before the start of incubation in each cell were set to 1. *indicates p < .001 compared with control. Images were taken using a time-lapse cell imaging system and are shown as merged fluorescence- and bright-field images (B). Fluorescence- and bright-field images are shown; arrows show the fluorescence emissions of neurite regions (C). One experiment per dish was set to at least four different fields and recorded every 10 min for 24 h. Each column represents the mean of four independent experiments. Data were analyzed using a one-way ANOVA.
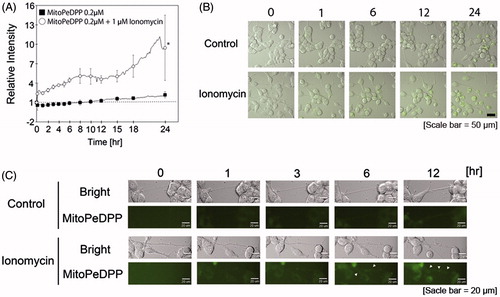
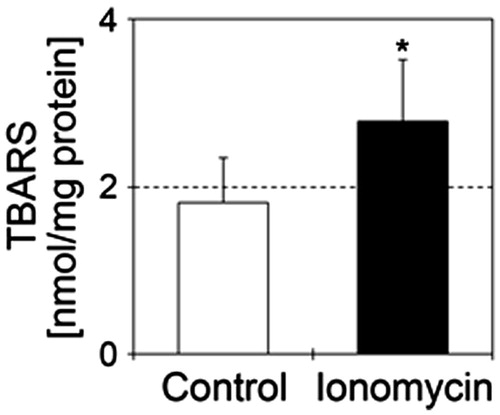
Figure 5. Ionomycin induces lipid peroxidation in N1E-115 cells. TBARS values are shown in the presence or absence of 1 μM ionomycin. Details of sample preparation and experimental conditions are as described in the section “Materials and methods”. White and black bars show control (n = 5) and ionomycin-treated cells (n = 5), respectively. Seventy-two hours after culture for neurite elongation, cells were treated with 1 μM ionomycin for 24 h. Data were analyzed using a Student’s t-test, indicates *p < .05 and ***p < .001 compared with control.