Figures & data
FIG. 1 Preparation of pectin and pectin/zein beads.
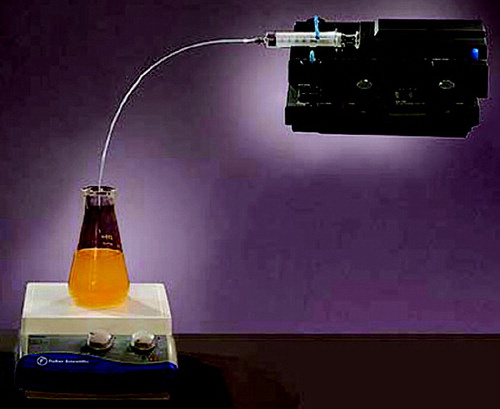
TABLE 1 Characterization of pectin and pectin/zein beads
TABLE 2 Determined amount of drugs in beads
FIG. 2 (A) Autofluorescence images of pectin (top) and pectin/zein beads (bottom; field width, 2.5 mm). (B) SEM photographs of pectin (left) and pectin/zein beads (right). From top to bottom: whole beads at low magnification (field width, 2.7 mm), whole beads at high magnification (field width, 27 μm), cut beads at low magnification (field width, 2.7 mm), and cut beads with high magnification (field width, 27 μm).
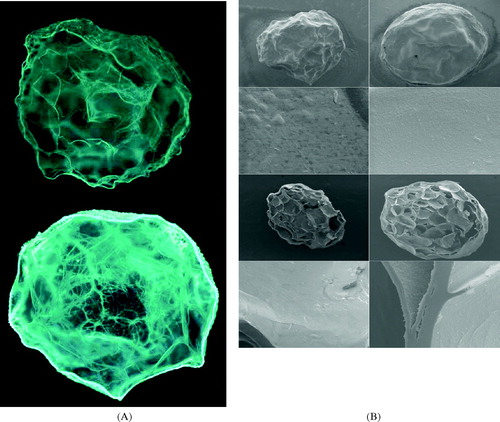
FIG. 3 Swelling measurement of drug-free pectin hydrogel beads in solutions with different pH at ambient temperature. For calcium pectinate (sample code I), a pH-dependent swelling behavior could be clearly seen at pH 3.5 (dash line), pH 5.0 (solid line), and pH 7.4 (dotted line). For pectin/zein complex (sample code II; dash-dotted line), no obvious changes in beads size could be recorded at pH 7.4; the same at pH 3.5 and pH 5.0 (data not shown).
FIG. 4 Cumulative release of indomethacin from pectin beads (•-sample code I) and pectin/zein beads (○-sample code II) at 37°C. The release media were changed in the sequence of (zone I) 0.01 M KH2PO4-citrate buffer (pH 3.5) for 2 hr, (zone II) Sorensen's phosphate buffer (pH 7.4) for 4 hr, and (zone III) 0.05 M phosphate-citrate buffer (pH 5.0) containing Pectinex 3XL (120 FDU/ml) for 8 hr.
FIG. 5 Cumulative release of bovine serum albumin from pectin beads (○-sample code I) and pectin/zein beads (○-sample code II; ∇-sample code IV) at 37°C. The release media were changed in the sequence of (zone I) 0.01 M KH2PO4-citrate buffer (pH 3.5) for 2 hr, (zone II) Sorensen's phosphate buffer (pH 7.4) for 4 hr, and (zone III) 0.05 M phosphate-citrate buffer (pH 5.0) containing Pectinex 3XL (120 FDU/ml) for 8 hr.
FIG. 6 Effect of pepsin on zein degradation. Pectin/zein complex beads (sample II ○ and sample III ○) were incubated in KH2PO4-citrate-pepsin buffer containing pepsin of different concentrations at pH 3.5 at 37°C for 4 hr.
FIG. 7 Effect of incubation time on zein digestion of sample II (○) and sample III (○). Concentration of pepsin, 2 mg/100 ml.
FIG. 8 Dextran released from pectin/zein beads after incubation with pepsin for 4 hr (black bar) or 20 hr (gray bar). Concentration of pepsin, 2 mg/100 ml. *, ** p < 0.05; # not significant.