1,591
Views
8
CrossRef citations to date
0
Altmetric
Research Article

Development of Controlled Release Captopril Granules Coated with Ethylcellulose and Methylcellulose by Fluid Bed Dryer

, , &
Pages 11-18 | Received 30 Jan 2007, Accepted 18 Jun 2007, Published online: 10 Oct 2008

Figures & data

TABLE 1 Summary of granules composition of the different formulations

FIG. 1 Scanning electron microscopy of captopril (panels A and B, magnification × 200 and ×400, respectively).
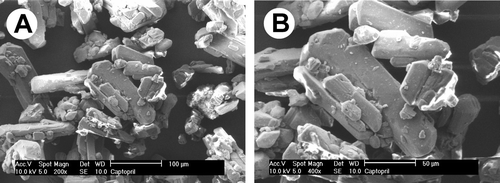
FIG. 1 Scanning electron microscopy of captopril (panels A and B, magnification × 200 and ×400, respectively).

FIG. 2 X-ray diffraction spectra of captopril and granules coated with PVP, methylcellulose/ethylcellulose, and ethylcellulose.
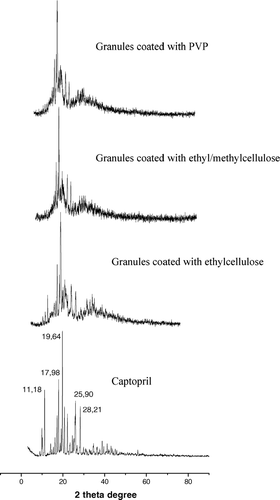
FIG. 2 X-ray diffraction spectra of captopril and granules coated with PVP, methylcellulose/ethylcellulose, and ethylcellulose.

FIG. 3 Scanning electron microscopy of captopril granules with different coatings. Coating of PVP (panels A and B, magnification × 50 and × 100); coating of ethyl/methylcellulose (panels C and D, magnification × 50 and × 100, respectively), and coating of ethylcellulose (panels E and F, magnification × 50 and ×100, respectively).
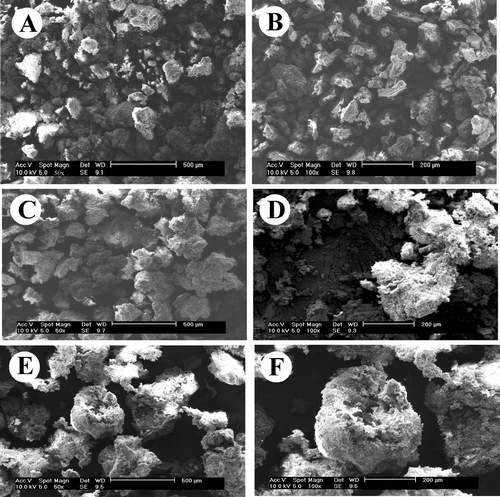
FIG. 3 Scanning electron microscopy of captopril granules with different coatings. Coating of PVP (panels A and B, magnification × 50 and × 100); coating of ethyl/methylcellulose (panels C and D, magnification × 50 and × 100, respectively), and coating of ethylcellulose (panels E and F, magnification × 50 and ×100, respectively).

FIG. 4 Release profiles of granules coated with PVP, granules coated with ethylcellulose, and granules coated with ethyl/methylcellulose.
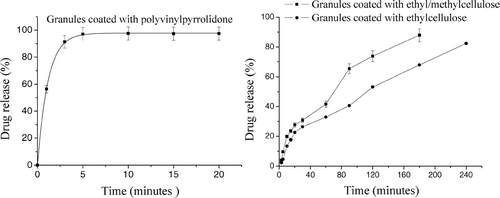
FIG. 4 Release profiles of granules coated with PVP, granules coated with ethylcellulose, and granules coated with ethyl/methylcellulose.

FIG. 5 Linearity of different granules forms using equation 1.
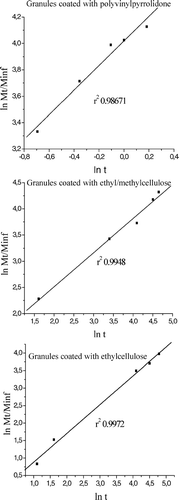
FIG. 5 Linearity of different granules forms using equation 1.

TABLE 2 Analysis of release data from captopril granules

FIG. 6 Effects of captopril granules coated with ethylcellulose and PVP on vasoconstrictive response to angiotensin I. Animals were treated orally with formulations or PBS (control). At indicated times animals were prepared for mean arterial pressure measurement. Thus, the vasoconstrictive response to angiontensin I (30 pmol/kg; panel A) and mean blood pressure (panel B) were recorded. Each point or bar represents the mean of 5 animals and vertical lines are the S.E.M. * p < 0.05 compared with the control group (PBS). Statistical analysis was performed using ANOVA test followed by Bonferroni's posthoc t test.
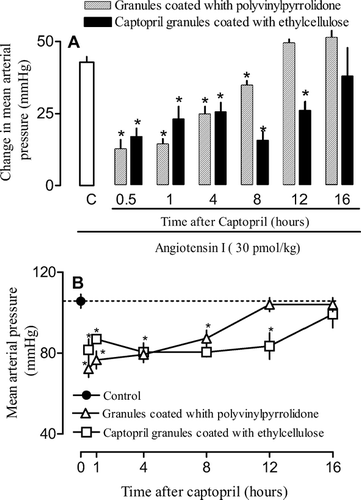
FIG. 6 Effects of captopril granules coated with ethylcellulose and PVP on vasoconstrictive response to angiotensin I. Animals were treated orally with formulations or PBS (control). At indicated times animals were prepared for mean arterial pressure measurement. Thus, the vasoconstrictive response to angiontensin I (30 pmol/kg; panel A) and mean blood pressure (panel B) were recorded. Each point or bar represents the mean of 5 animals and vertical lines are the S.E.M. * p < 0.05 compared with the control group (PBS). Statistical analysis was performed using ANOVA test followed by Bonferroni's posthoc t test.

FIG. 7 Effects of captopril granules coated with ethyl/methylcellulose and PVP on vasoconstrictive response to angiotensin I. Animals were treated orally with formulations or PBS (control). At indicated times animals were prepared for mean arterial pressure measurement. Thus, the vasoconstrictive response to angiontensin I (30 pmol/kg; panel A) and mean blood pressure (panel B) were recorded. Each point or bar represents the mean of 5 animals and vertical lines are the S.E.M. * p < 0.05 compared with the control group (PBS). Statistical analysis was performed using ANOVA test followed by Bonferroni's posthoc t-test.
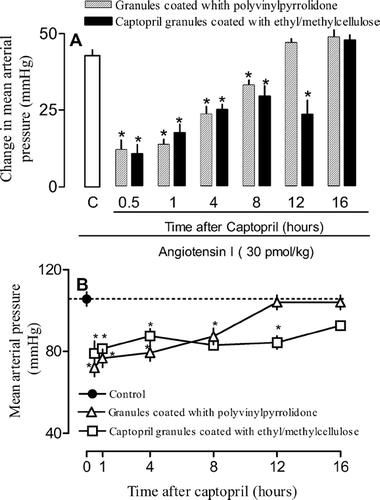
FIG. 7 Effects of captopril granules coated with ethyl/methylcellulose and PVP on vasoconstrictive response to angiotensin I. Animals were treated orally with formulations or PBS (control). At indicated times animals were prepared for mean arterial pressure measurement. Thus, the vasoconstrictive response to angiontensin I (30 pmol/kg; panel A) and mean blood pressure (panel B) were recorded. Each point or bar represents the mean of 5 animals and vertical lines are the S.E.M. * p < 0.05 compared with the control group (PBS). Statistical analysis was performed using ANOVA test followed by Bonferroni's posthoc t-test.

Reprints and Corporate Permissions

Please note: Selecting permissions does not provide access to the full text of the article, please see our help page How do I view content?

To request a reprint or corporate permissions for this article, please click on the relevant link below:

Academic Permissions

Please note: Selecting permissions does not provide access to the full text of the article, please see our help page How do I view content?

Obtain permissions instantly via Rightslink by clicking on the button below:

If you are unable to obtain permissions via Rightslink, please complete and submit this Permissions form. For more information, please visit our Permissions help page.