
Figures & data
Figure 1. (A) Synthesis of PBLA-PEG-PBLA triblock copolymers. (B) 1H NMR spectrogram of PBLA-PEG-PBLA. (C) Phase diagrams of the PBLA-PEG-PBLA copolymer aqueous solutions.
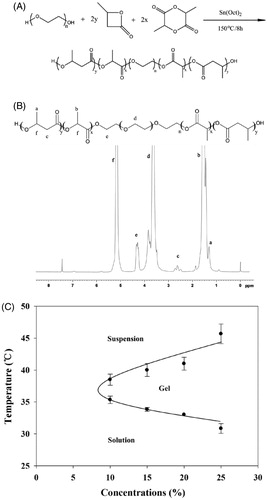
Figure 2. (A) Phase transition process of copolymer solutions (15%, w/w) characterized by the variance of storage modulus and loss modulus as a function of temperature. (B) Storage modulus of copolymer solutions at different concentration as a function of temperature. (C) Viscosity of copolymer solutions at different concentration as a function of temperature. (D) Required force to inject copolymer solution (15%, w/w) from 1 mL syringes equipped with 24 G × 20 mm, 27 G× 12.9 mm needles into air at the crosshead speed of 1 mm·s−1. (E) Required force to inject copolymer solutions at different concentration from 1 mL syringes equipped with 27 G × 12.9 mm needles into air at the crosshead speed of 1 mm·s−1. (F) Variation trend of gelation temperature and required force to inject copolymer solutions on different concentration of PBLA-PEG-PBLA solution.
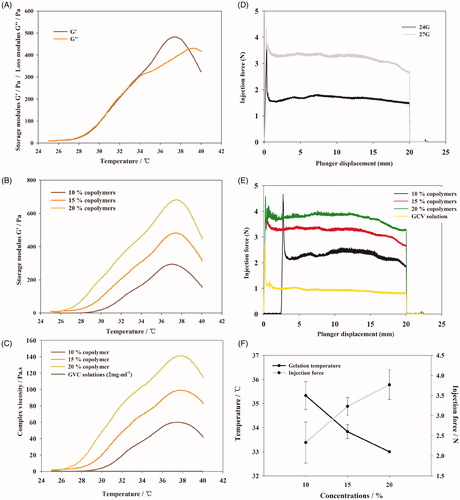
Figure 3. (A) Percent of the remaining hydrogel during in vitro degradation in PBS at 37 °C. The concentrations of polymer were 10, 15, and 20% (w/w), respectively. (B) Morphology of PBLA-PEG-PBLA hydrogel with different polymer concentration 10, 15, and 20% (w/w). (C) GPC chromatograms of the remaining gels during in vitro degradation. (D) GPC chromatograms of the degraded hydrogels during in vitro degradation.
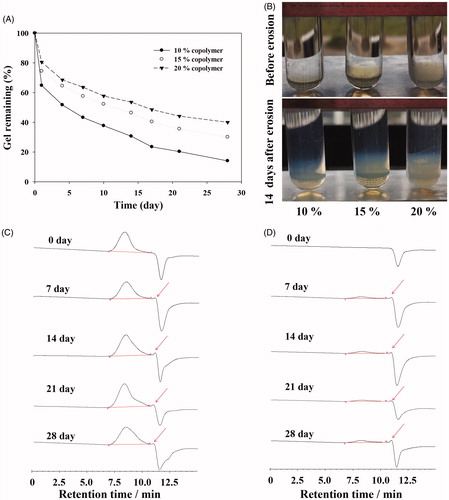
Figure 4. (A) Viscosity of GCV in situ hydrogel as a function of temperature. (B) Required force to inject GCV in situ hydrogel from 1 mL syringers equipped with 27 G × 12.9 mm needles into air at the crosshead speed of 1 mm·s−1. (C) In vitro GCV release profiles from GCV in situ hydrogel in phosphate buffer solution (PBS, pH 7.4) at 37 °C with 1% hyaluronic acid (HA, w/w).
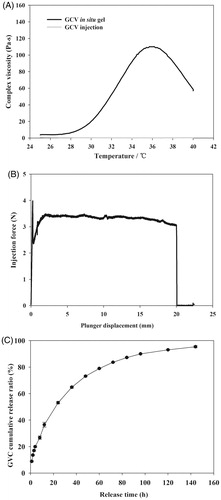
Figure 5. Viability of L-02 cell culture with different concentration of PBLA-PEG-PBLA (A) and compare with SDS at 24 h (B); (C) histology of conjunctivae and sclera 2 weeks after intravitreous injection. Sections were embedded in paraffin and stained with H & E; (D) aqueous humor and (E) vitreous concentration-time profile of GCV after intravitreous injection of GCV in situ hydrogel and GCV injection in rabbits, respectively, (n = 6).
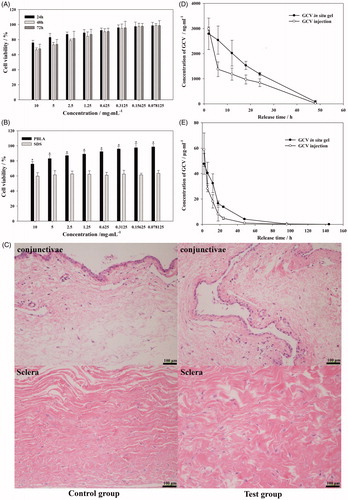
Table 1. Pharmacokinetics parameter of GCV in aqueous humor and vitreous.