Figures & data
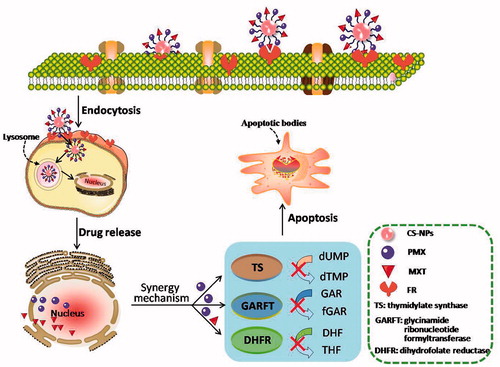
Scheme 1. Schematic illustration for co-delivery processing of both MTX and PMX loaded PCNPS in target tumor cells by active targeting.
Scheme 2. Synthetic pathways in formation of MTX-PMX-PCNPS.
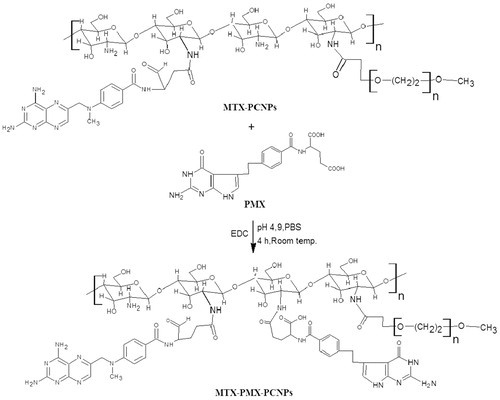
Figure 1. FTIR spectra (A); transmission electron microscopy images (B); Size distribution (C), Zeta potential (D) of MTX-PMX-PCNPs; Characteristics of NPs (E); In vitro release cumulative of MTX (F) and PMX (H) from nanocarriers, free MTX (G) and PMX (I) in PBS at pH 6.5 and 7.4 (37 °C, n = 3).
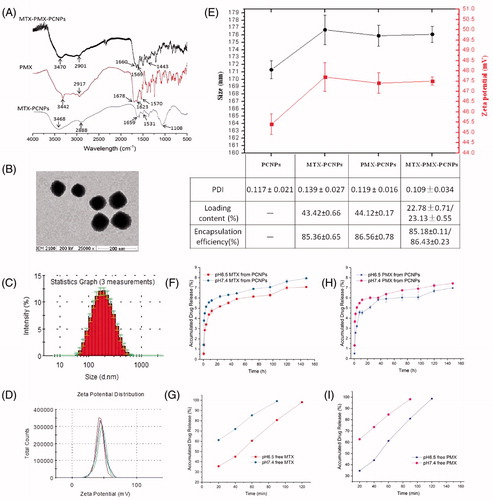
Figure 2. CLSM micrograph of cellular uptake performed on A549 cells following 24 h incubated with fluorescently labeled MTX + PMX, PCNPs, MTX-PCNPs, PMX-PCNPs and MTX-PMX-PCNPs. Bright field image shows the morphologic correspondence of A549 cells. Nuclei stained with DAPI are blue and different formulations in green.
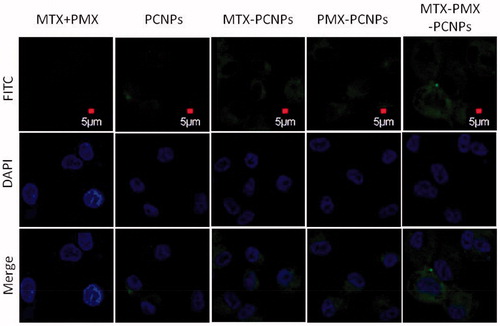
Table 1. The values of IC50 and CI after the treatment with different formulations following 72 h exposure measured by CCK8 assay performed on A549 cells (**p < .01).
Figure 3. Viability of A549 cells treated with various concentrations drugs loaded PCNPs at various concentrations for 24 h (A), 48 h (B), and 72 h (C); MTX-PMX-PCNPs at various concentrations and time (D) (n = 3).
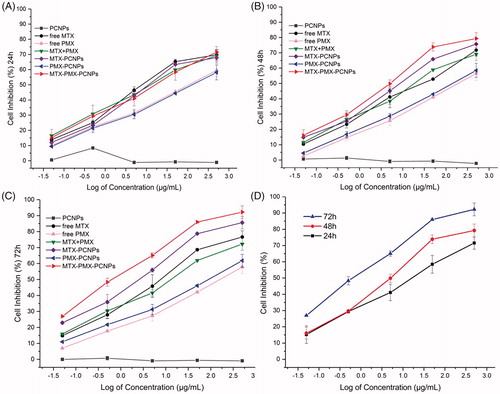
Figure 4. Cell cycle analysis through PI staining of cells (A) treated with control, MTX + PMX, PCNPs, MTX-PCNPs, PMX-PCNPs and MTX-PMX-PCNPs. Cells cycle distribution (B) after various treatments (n = 3).
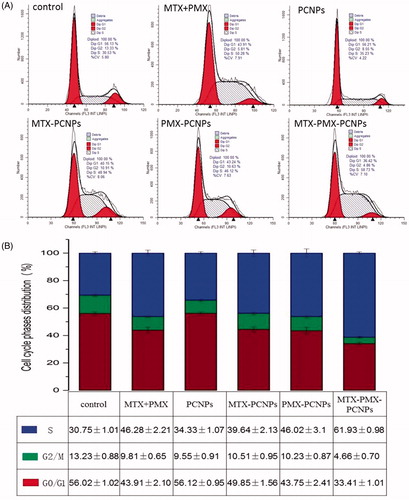
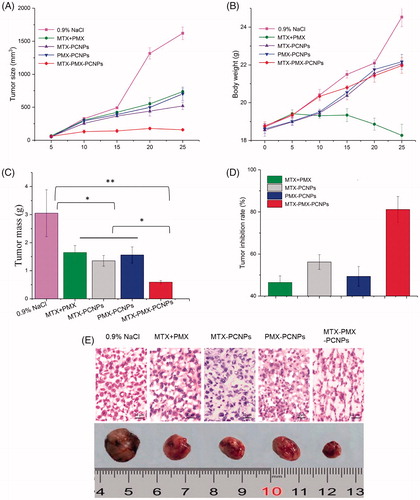
Figure 5. Tumor size (A), body weight changes (B), and weight of the solid tumors (C) of lung cancer animal model in different treatment groups within 25 days, The tumor inhibition rate for five groups upon treatment with different formulations (D), Digital photographs and H&E stained images of dissected tumors of representative mice after treated with different formulations. Sections were observed under 40× magnifications (E). Data are reported as means ± SD (n = 5). *p < 0.05, **p < 0.01.