Figures & data
Figure 1. mTHPC-loaded nanocarriers characterization. (A) Size distribution profile of mTHPC-EVs, obtained by NTA (left panel) and repartition of exosomes and microvesicles in mTHPC-EVs population by flow cytometry analysis (right panel) using specific antibodies. (B) Normalized absorption spectra (left panel) of free mTHPC in ethanol and PBS, Foslip® in PBS and mTHPC-EVs in PBS. mTHPC concentration was 1.45 µM. Right panel displays photophysical parameters derived from absorption spectra. λmax (nm): maximal wavelength of absorption; υ (cm–1): half height bandwidth; F.Y: fluorescence yield; I/Ix-100: normalized fluorescence (exposure 500 mJ/cm2).
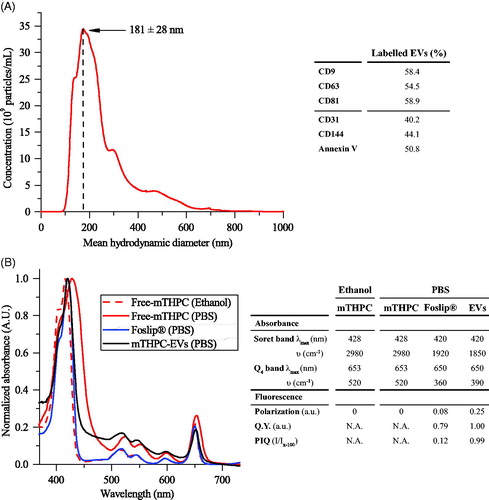
Figure 2. Cryo-TEM images of (A) Foslip® and (C) mTHPC-EVs. Arrows show membrane fragments of Foslip®. Scale bar: 100 nm. mTHPC concentration was 10 mM. Histograms of (B) Foslip® and (D) mTHPC-EVs particles distribution obtain by NTA. (E) Fluorescence profile of mTHPC formulations after migration in agarose gel showing mTHPC leakage from nanocarriers. Nanocarriers were incubated in PBS (0 h) or 20% murine plasma at 37 °C. mTHPC concentration was 20 µM.
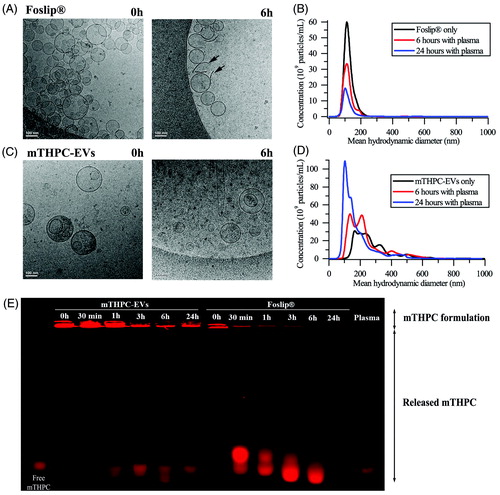
Figure 3. (A) Typical confocal images HT29 cells costaining with different mTHPC formulations (1.45 µM) and Lysotracker®. Left panel displays mTHPC images, center panel displays Lysotracker® images and right panel displays overlay images. These images were representative of three independent experiments. Scale bar: 50 µm (B) PCC values obtained from overlay images. (C) Endocytosis pathways inhibition of cellular uptake of mTHPC formulations after incubation at 4 °C or 37 °C with endocytosis inhibitors. *: p < .05 compared to free and liposomal mTHPC.
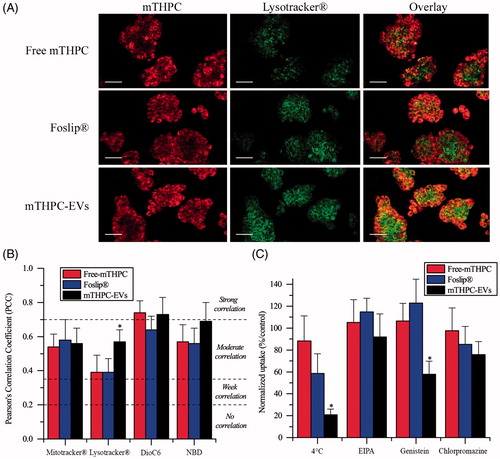
Figure 4. Kinetics of mTHPC uptake in HT29 spheroids after incubation with free mTHPC, Foslip® and mTHPC-EVs. mTHPC concentration was 3.6 µM. Chemical extraction of mTHPC was realized in absolute ethanol. *: p < .05.
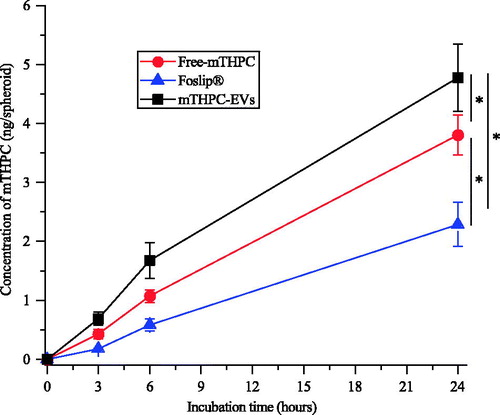
Figure 5. Typical fluorescence images and corresponding fluorescence profiles of spheroids after 24 h incubation with (A, D) free mTHPC, (B, E) Foslip® and (C, F) mTHPC-EVs. mTHPC concentration was 3.6 µM. Scale bar: 100 µm. (G) Based on fluorescence plot profiles, normalized fluorescence was computed in a function of the distance from the periphery of spheroids. *: p < .05 compared to free mTHPC.
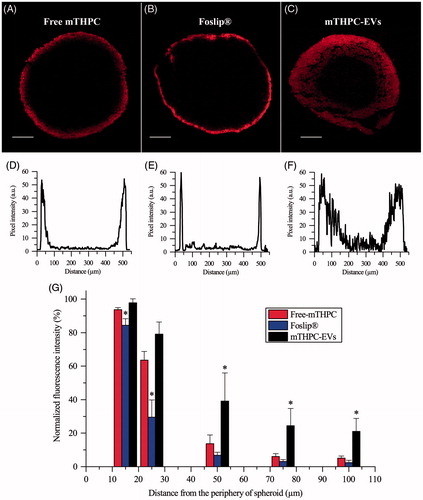
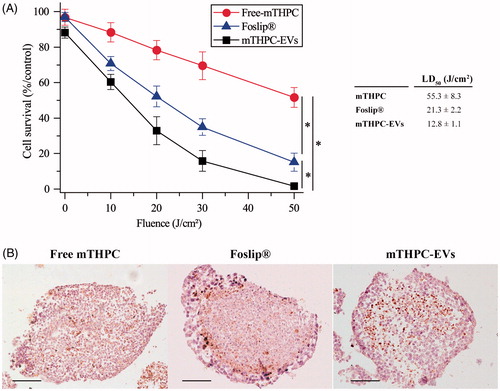
Figure 6. Photocytotoxicity of mTHPC formulations (3.6 µM) after 24 h incubation with spheroids. (A) Cell survival in function of applied fluence (fluence rate 30 mW/cm2). *: p < .05. On the insert, the light dose inducing 50% of cell death (LD50) is presented for each formulation. (B) IHC images of active caspase-3 staining (×10) in spheroids loaded with different mTHPC formulations and assessed 6 h post irradiation (30 mW/cm2; 30 J/cm2). These images are representative of three independent experiments. Scale bar: 100 µm.