Figures & data
Figure 1. LyP-1 is a cryptic CendR peptide. Cyclic LyP-1 concentrates at the surface of tumor cells by binding to its primary receptor p32. LyP-1 is then proteolytically cleaved into the linear truncated form, tLyP-1, which diminishes its affinity for p32. The exposed C-terminal CendR motif becomes active and triggers binding to NRP1 and/or NRP2, and subsequent cell internalization (adapted from Roth et al., Citation2012).
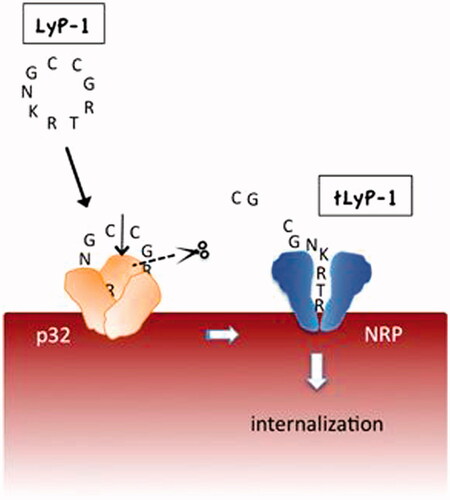
Figure 2. MR scan of orthotopic pancreatic tumor bearing mice at 3T. The T2 weight MR images of orthotopic pancreatic cancer (circled by red dash line) in C57BL/6 mice before and after administration of the Fe3O4@SiO2-FITC@mSiO2-LyP-1 or Fe3O4@SiO2-FITC@mSiO2 systemically at different time point. The inset is the enlarged pictures of corresponding tumor region (adapted from Jiang et al., Citation2017).
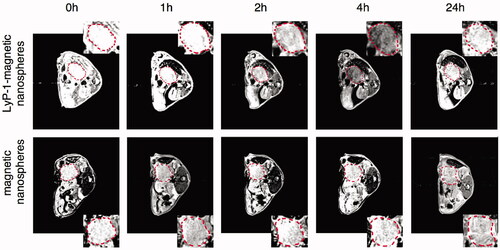
Figure 3. Optical imaging of tumor-induced lymphangiogenesis with Cy5.5-LyP-1. At days 3, 7, 14 and 21 after 4T1 cell inoculation, tumor-bearing BALB/C mice (n = 5/group), under isoflurane anesthesia, were injected with Cy5.5-LyP-1 via the middle phalanges of both upper extremities. At 45 min after injection, in vivo fluorescence imaging of both tumor-draining LNs (a) and contralateral LNs (b) was performed with a Maestro II small-animal in vivo imaging system. The fluorescence images consisting of Cy5.5 and autofluorescence spectra were then unmixed based on their spectral patterns with the manufacturer’s software (Maestro software, CRI). The tumors are indicated by circles. (c and d) At 24 h post injection, the mice were killed and a dorsal skin flap was elevated to expose the brachial lymph nodes on both sides for a repeat of fluorescence imaging (c. tumor-draining LNs; d. contralateral LNs) (adapted from Zhang et al., Citation2012).
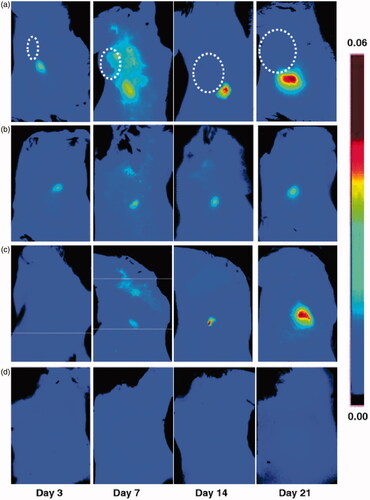
Figure 4. In situ and ex vivo fluorescence imaging of the mice after 48 h of Cy5.5 labeled HspG41C or LyP-Hsp injection. In both the in situ and ex vivo images, the LyP-Hsp injected mouse provided more intense fluorescence signal from the left common carotid artery (LCCA) than the right common carotid artery (RCAA) (adapted from Uchida et al., Citation2011).
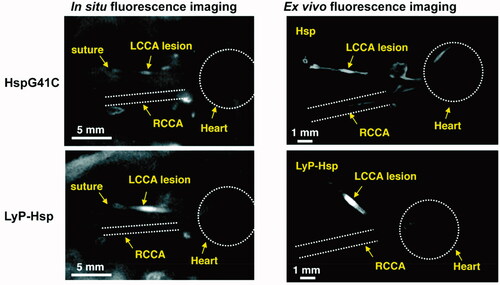
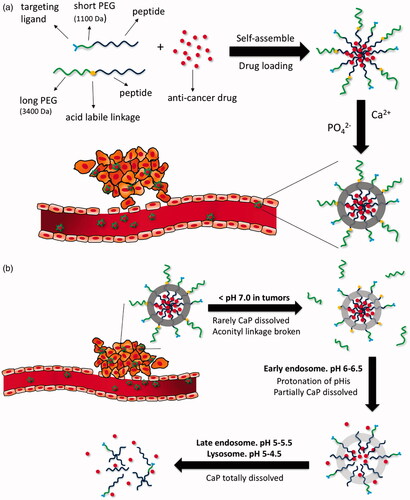
Figure 5. (a) Formation of DOX-loaded nanoparticles with calcium phosphate mineralization layer. (b) Illustrative structural transition of nanoparticles at different in vivo conditions (adapted from Wang et al., Citation2017).