Figures & data
Table 1. The 24 full factorial design and the observed responses of FVS-loaded SNVs.
Figure 1. Response surface plot for the effect of Span type (A), EA type (B) at the middle levels of the 3rd and 4th variables (EA concentration and sonication time) on (a) EE%, (b) vesicle size, (c) Q8h, (d) Q24, and (e) desirability of the developed SNVs dispersions.
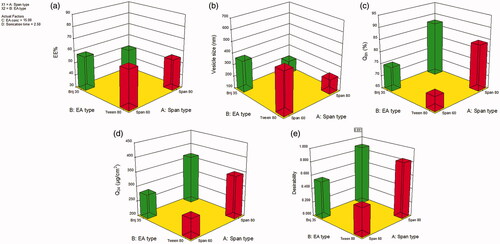
Figure 2. Transmission electron micrograph of the optimal SNVs formulation.
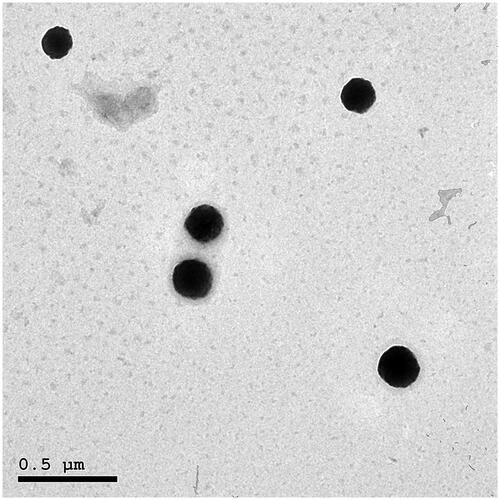
Table 2. Mean pharmacokinetic parameters for FVS in rat plasma following administration of oral solution, SNVs gel and traditional gel.
Table 3. Biochemical analysis in different studied groups.
Figure 3. Radiological changes of joints. (a) Normal control group. (b1 and b2) Arthritis control group showing foot deformity, marked knee joint space narrowing and osteopenia. (c) Methotrexate-treated group showing normal joint space, but mild foot deformity. (d) Oral FVS-treated group showing mild narrowing of joint space, mild foot deformity and osteophytes. (e) FVS-loaded SNVs gel-treated group showing relative narrowing of knee joint space with mild foot deformity without osteopenia or osteophytes.
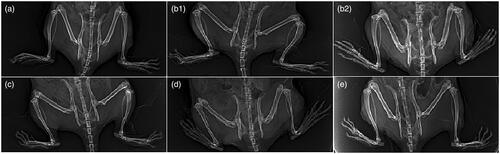
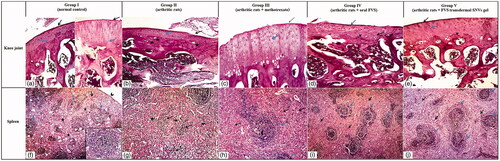
Figure 4. Photomicrographs of articular cartilage and splenic parenchymae of different sections in different groups (H&E ×100). (a–e) Articular cartilage of different groups. (a) Normal control rat section showing a smooth articular surface (black arrow) and a regular tide mark (blue arrow) separating the articular cartilage from the underlying subchondral bone. (b) Arthritis control rat section showing disrupted articular surface (black arrow), cartilage layer was thinner with cell loss, cell cloning and multicellular chondrocyte clusters and overall the cells appeared in a less ordered structure (blue arrow). The subchondral bone invaded the calcified cartilage (stars), top right. (c) Methotrexate-treated arthritic rat section showing slight smooth articular surface (black arrow), thickened articular cartilage with proliferating chondrocytes (blue arrow), hypercellularity and cloning. Regular tide mark can be seen (arrowhead). (d) Oral FVS-treated arthritic rat section showing slightly smooth articular surface (blue arrow) with thinner articular cartilage layer. The subchondral bone (star) can be observed. The proliferating chondrocytes showing hypercellularity, cloning, and slightly ordered distribution (black arrow). Regular tide mark can be seen (arrowhead). (e) FVS-loaded SNVs gel-treated arthritic rat section showing smooth articular surface (black arrow). Thickened articular cartilage and subchondral bone (star) can be observed. The proliferating chondrocytes showing hypercellularity, cloning, and slightly ordered distribution (blue arrow). Regular tide mark can be seen (arrowhead). (f–j) Splenic parenchymae of different sections. (f) Normal control rat section showing thin capsule (arrowhead), trabeculae (black arrow) and white pulp formed of lymphatic follicles (blue arrow) surrounded with red pulp (stars). Inserted box showing lymphatic follicles with central arteriole and well-defined marginal zone. (g) Arthritis control rat section showing marked atrophy of white pulp (black arrow) and red pulp (stars). (h) Methotrexate-treated arthritic rat section showing proliferating lymphatic follicles (white pulp) (blue arrow) surrounded with hyperplastic red pulp (black arrow). Lymphatic follicles showing central arteriole (arrowhead) and well-defined marginal zone. (i) Oral FVS-treated arthritic rat section showing slightly proliferating lymphatic follicles (white pulp) (blue arrow) surrounded with hyperplastic red pulp (black arrow). Lymphatic follicles showing central arteriole and well-defined marginal zone. (j) FVS-loaded SNVs gel-treated arthritic rat section showing slightly proliferating lymphatic follicles (white pulp) (blue arrow) surrounded with hyperplastic red pulp (black arrow). Lymphatic follicles showing central arteriole and well-defined marginal zone.