Figures & data
Figure 1. Characterization of BSA hybrid nanostructures. (A) TEM imaging of BMDI and GSH-reduced BMDI, and the EDX analysis of BMDI, the scale bar represents 100 nm; (B) X-ray photoelectron spectroscopy (XPS) analysis of Mn in BMDI nanostructures; (C) Particle size distribution and (D) Zeta-potential of BM, BDI, BMDI and GSH-reduced BMDI; (E) UV-vis spectra and (F) Fluorescence spectra of BMDI and GSH-reduced BMDI.
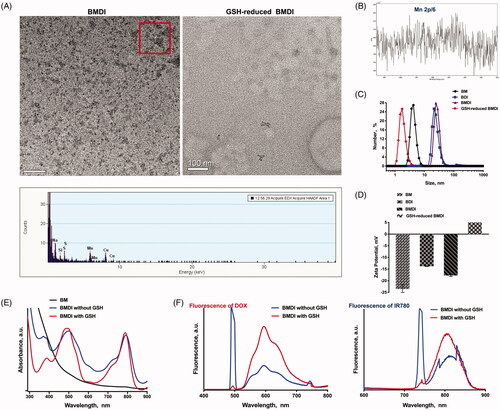
Figure 2. The in vitro environment-responsive MR imaging. (A) In vitro T1 weighted MR images of BMDI at different GSH concentrations and pH values; (B) the T1-weighted relaxivity (r1) calculated by the results of (A); (C) In vitro T1 weighted MR images of BMDI at different pH values; (D) the T1-weighted relaxivity (r1) calculated by the results of (C).
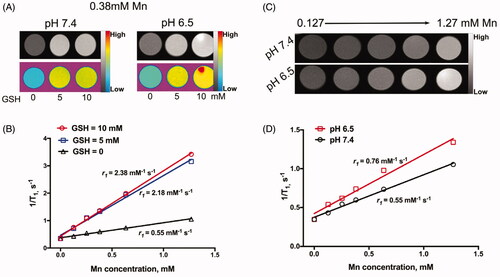
Figure 3. In vitro drug release profiles. (A) Oxygen production of BMDI and BM Nanostructure dispersed in buffer with the presence of H2O2; (B) Oxygen bubbles generation and the color alteration of BMDI dispersion with H2O2 or GSH presented at pH 6.5; (C) Accumulative DOX release of BMDI within different environments; (D) Release behavior of BMDI in alternative release buffers.
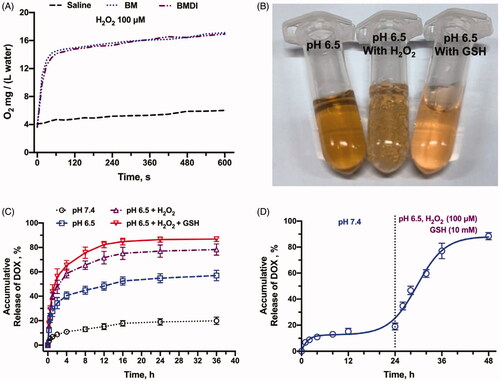
Figure 4. (A) Cell uptake images with different formulations after 4 h incubations. The red fluorescence represents DOX, and the nucleus were labeled with blue fluorescence (n = 3, ‘**’ p < .01 was considered with significance. Scale bar is 20 μm); (B) Semi-quantitative analysis based on (A); (C) Cell survival after treating with free IR780 and DOX, BM, BI, BD, BDI or BMDI nanostructure.
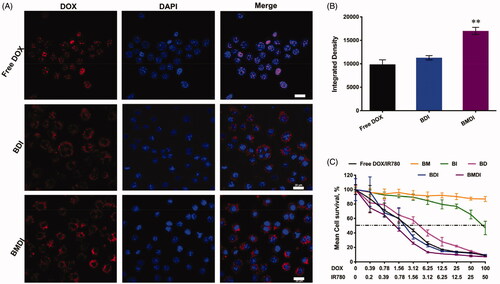
Figure 5. (A) Temperature curves of BMDI dispersions with different concentrations exposed to NIR laser irradiation; (B) Living/dead cell-staining after BMDI treatments with or without photothermal ablation; Cell survival assay for different BSA-based formulations treatment: for (C) without laser irradiation, and for (D) with laser irradiation. Data reported represent mean ± SD (n = 3, and ‘*’ p < .05).
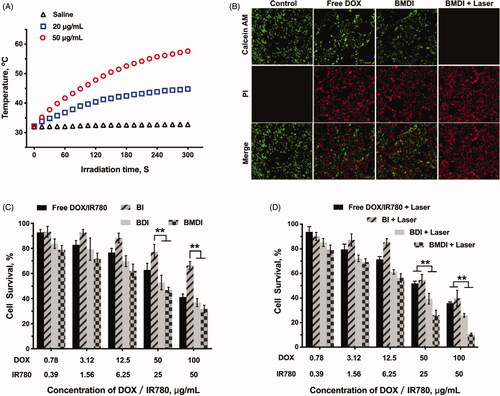
Figure 6. Biodistribution of BMDI in vivo. (A) The linearity of fluorescence intensity of BMDI dispersion in vitro; (B) Living fluorescence imaging of the nanostructures distribution on MCF-7 tumor-bearing mice; (C) Ex vivo fluorescence imaging of tumor, fur and organs eviscerated from mice at the end of the imaging experiment; (D) Semi-quantification of fluorescent intensity based on the results of (C) (‘**’ p < .01).
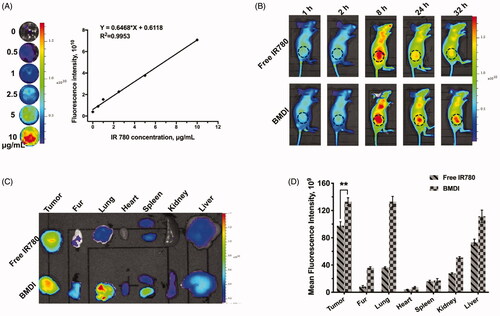
Figure 7. The antitumor investigation of BMDI. (A) In vivo photothermal conversion of BMDI; (B) Relationships of photothermal conversion in vivo; (C) Tumor volume variation of groups with various administrations; (D) Tumor weight from each group of the mice; (E) Mean body weights of the mice for each treatment. (n = 5, means ± SD, ‘**’ represents p < .01).
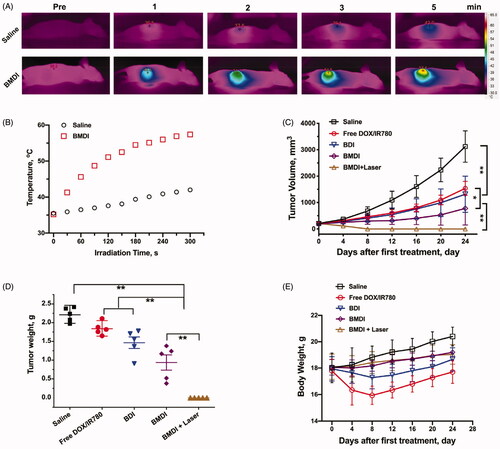
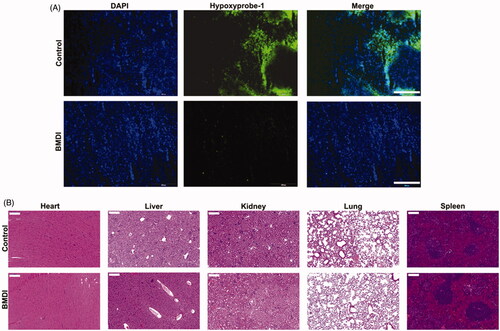
Figure 8. (A) Immunofluorescence images of the tumor slides with hypoxia biomarker staining for control and BMDI-treated groups; (B) Histochemical images of major organs (heart, liver, kidney, lung and spleen) for control and BMDI-treated groups. (Scale bar is 200 µm).