
Figures & data
Table 1. Full factorial design (21, 51) used for optimization formulations showing independent, dependent variables (responses) and desired outcomes.
Table 2. Composition of DOM-loaded ethosomal suspensions.
Table 3. Composition of prepared gels loaded DOM-ethosomal suspension.
Table 4. Vesicular size, PDI, zeta potential (ZP), EE%, and % drug released after 6 h (Q6h) of DOM-loaded ethosomal suspension (mean ± SD, n = 3).
Figure 1. In vitro release profiles of DOM solution and different DOM-loaded ethosomes formulations in phosphate buffer saline (pH 6.8) at 37 °C ± 0.5 °C.
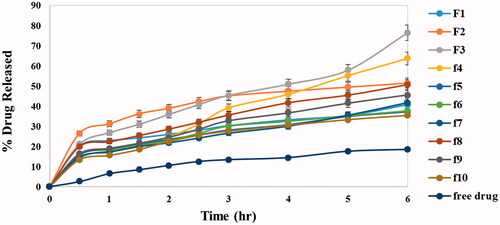
Figure 2. Response bar plots for the effect of lecithin concentration (%) (X1) and additives (X2) on (A) PS, (B) ZP, (C) %EE, and (D) Q6h on DOM-loaded ethosomes.
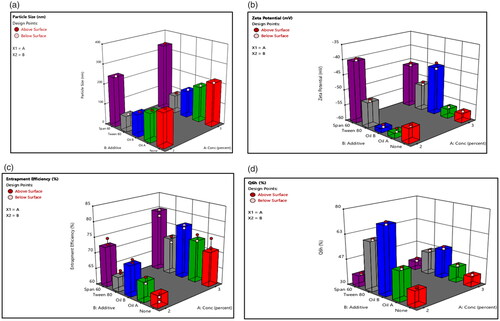
Table 5. Output data of the (21, 51) full factorial analysis of the formulas, predicted and actual values for the optimum formulation (F3).
Figure 3. (A) Desirability 3D surface. (B) Desirability plot of the optimized formulation F3.
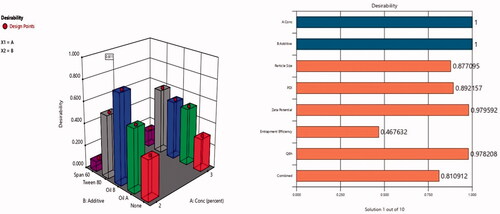
Figure 4. Particle size distribution of optimum formulation F3.
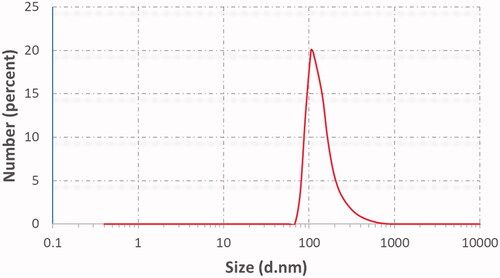
Table 6. The actual results of optimum formulation against the suggested one.
Figure 5. TEM image of the optimized DOM-loaded ethosomes (F3).
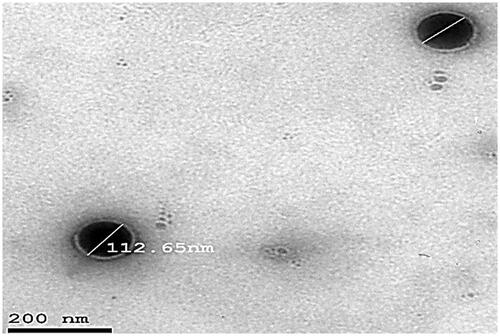
Figure 6. DSC thermograms of pure DOM, lecithin, and optimized DOM-loaded ethosomes (F3).
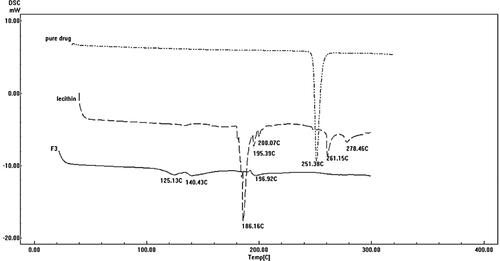
Figure 7. FTIR of pure DOM, lecithin, and optimum formula F3.
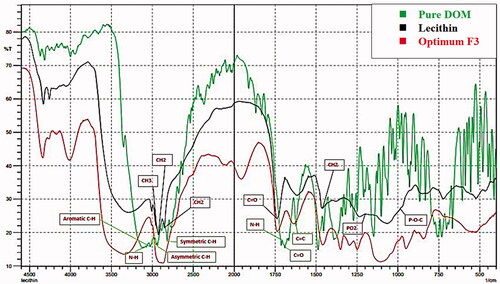
Table 7. Effect of storage on properties of selected formulation (F3).
Figure 8. Ex vivo permeation profiles of DOM from prepared ethosomal suspension (F3) compared to pure drug.
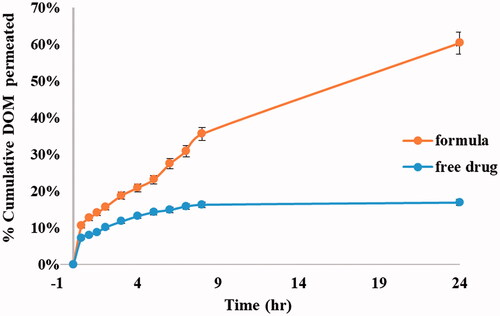
Figure 9. Rheological behavior of (a) (F11) ethosomal rectal gel (0.5% Carbopol), (b) (F12) ethosomal rectal gel (1% Carbopol), (c) (F13) free drug rectal gel 0.5% Carbopol, and (d) (F14) free drug rectal gel (1% Carbopol).
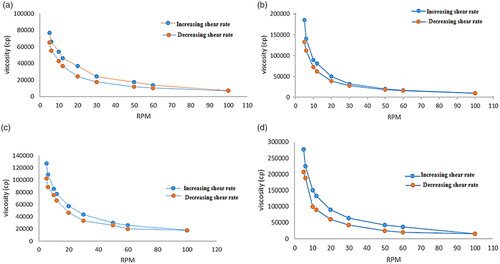
Figure 10. Mean DOM plasma concentration-time curves in rats after administration of a single dose (3.1 mg/kg) of DOM-loaded ethosomal gel (F11) and pure DOM gel (F13).
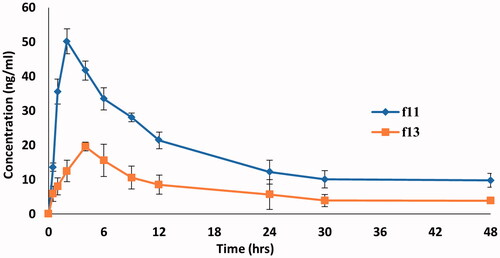
Table 8. Mean pharmacokinetics parameters of DOM following single rectal administration for DOM-loaded ethosomal gel (F11) and pure DOM gel (F13).
Data availability statement
All data and materials are available.