Figures & data
Figure 1. Overview of strategy in synthesis of hybrid network MEO2MA-OEGMA-MeHa-based NGs with enzymatically sensitive DEGDA crosslinker.
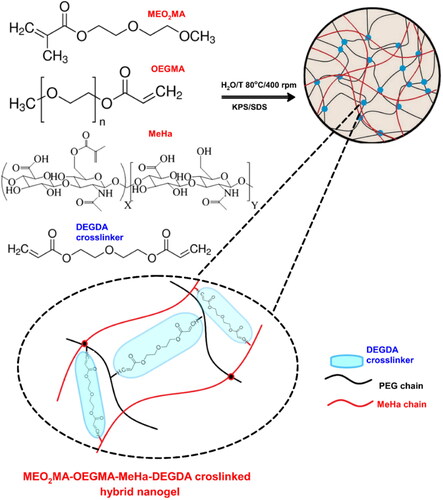
Table 1. Composition (mM) of enzymatically sensitive hybrid network nanogels.
Figure 2. (a) Comparison of 1H NMR spectra of MEO2MA-OEGMA30%-DEGDA-, MEO2MA-OEGMA30%-MeHa-DEGDA NGs and MeHa polymer (in D2O). (b) TEM micrograph exhibiting surface activity of carboxylic groups from MeHa chains in MEO2MA-OEGMA30% -MeHa-DEGDA NGs obtained after application of 1% uranyl acetate (UA) staining protocol.
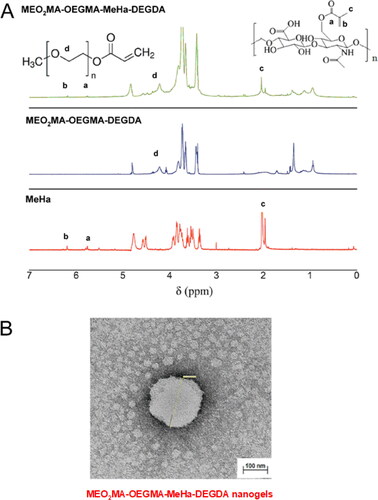
Table 2. Analysis of tunability of hydrodynamic parameters of hybrid and single network nanogels at dedicated temperatures by varying the content of thermosensitive OEGMA monomer.
Figure 3. (a) Plots of hydrodynamic diameter, Dh, vs temperature, obtained for MEO2MA-OEGDA30%-MeHa-DEGDA (blue line), MEO2MA-OEGDA15%-MeHa-DEGDA (red line) and MEO2MA-OEGDA30%-DEGDA (dark line). (b) Dependences of Dh on temperature obtained at various pH and referred to an aggregation process. MEO2MA-OEGDA- MeHa-DEGDA at pH 7.4 (green line), 5.0 (pink line), 9.0 (blue line), and MEO2MA-OEGDA-DEGDA at pH 5.0 (dark line). (c) Plots of zeta potential vs. temperature for increased carboxylic content in the MeHa-based network. (d) Quasi-reversible cycles of polydispersity index (PDI) changes seen at physiological- and hyperthermia-used temperatures and low acidic environment (pH 5); state of minimal tendency to NGs aggregation. All measurements were repeated three times. For clarity of the figure a single mean standard error was shown.
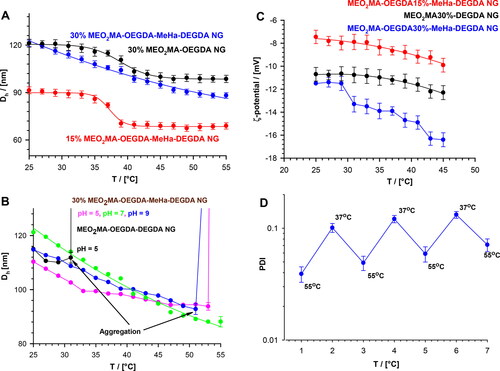
Figure 4. TEM micrographs of A) MEO2MA-OEGMA30%-MeHa-DEGDA NGs (pH 7.4), (B) MEO2MA-OEGMA30%-MeHa-DEGDA NGs taken 1-day after their treatment with 2 mg·mL−1 hyaluronidase enzyme (HAdase, pH 5.0). (C) MEO2MA-OEGMA30%-MeHa-DEGDA NGs reveal their HAdase-based enzymatic degradation at pH 5.0 after 1-week treatment.
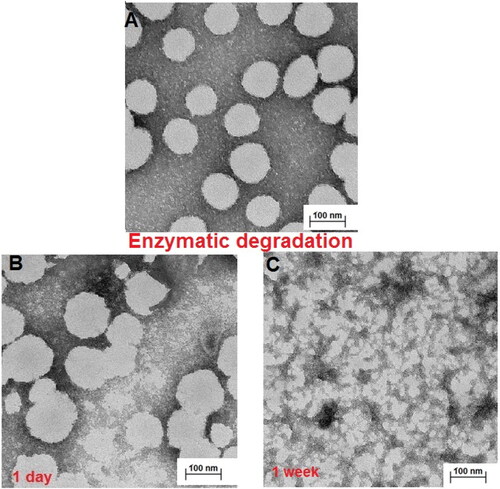
Figure 5. (a) Dependencies of light scattering intensity ratio, It/Io, on degradation time of MEO2MA-OEGMA30%-MeHa-DEGDA NGs at 37 °C in presence and absence of HAdase. Subscripts “0” and “t” represent time t = 0 and t = t, respectively. (b) Distribution of MEO2MA-OEGMA30%-MeHa-DEGDA NGs size presented as changes in scattered light intensity after various treatment times by HAdase enzyme. (c) Time dependencies of scattered light intensity (derived count rate, DCR) and hydrodynamic diameter, for MEO2MA-OEGMA30%-MeHa-DEGDA NGs after treatment with HAdase (2 mg/ml) and at pH 7.4 and 5.0. All measurements were repeated three times. For clarity of the figure a single mean standard error was shown.
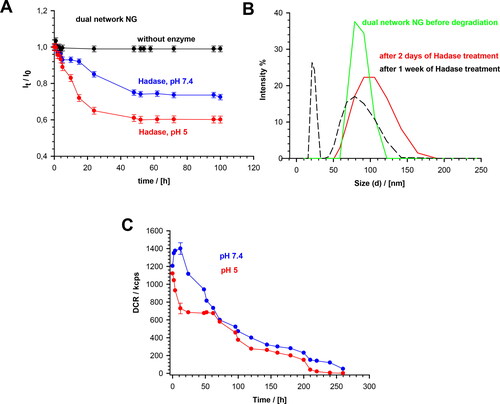
Figure 6. Profiles of DOX and MTX release from MEO2MA-OEGMA30%-MeHa-DEGDA NGs during enzymatic degradation at buffered solutions at 37 °C; HAdase concentration - 2 mg/ml. All measurements were repeated three times. For clarity of the figure a single mean standard error was shown.
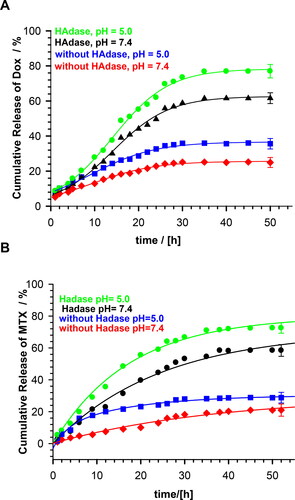
Table 3. Release parameters for MEO2MA-OEGMA30%-MeHa-DEGDA NGs as optimal for prolonged-, enzyme-triggered, and tumor-targeted NGs activity.
Figure 7. Results of MTT assay for MCF-10A and HOF healthy cell lines after 72-h treatment with free DOX, DOX-loaded and drug-free NGs. The red line depicts the threshold of 70% of cell viability in accordance with ISO 10993–5 (ISO 10993–5:2009, Citation2009). One way ANOVA was used to test for statistical significance. Differences from control sample were marked with *, whereas ** marked differences between groups. The difference was considered significant for P values <05.
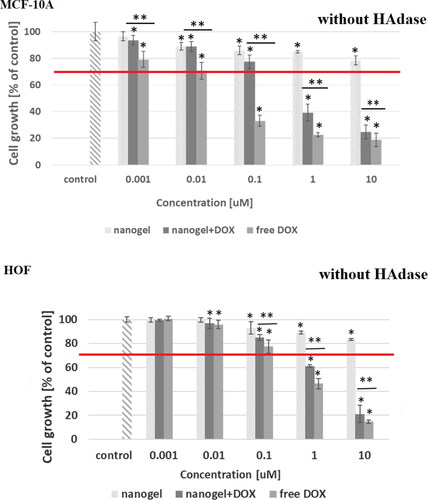
Figure 8. Results of MTT assay with MCF-7 cancer cell line and with and without HAdase after 72-h treatment with free DOX, DOX-loaded and drug-free NGs. One way ANOVA was used to test for statistical significance. Differences from control sample were marked with *, whereas ** marked differences between groups. The difference was considered significant for P values <05.
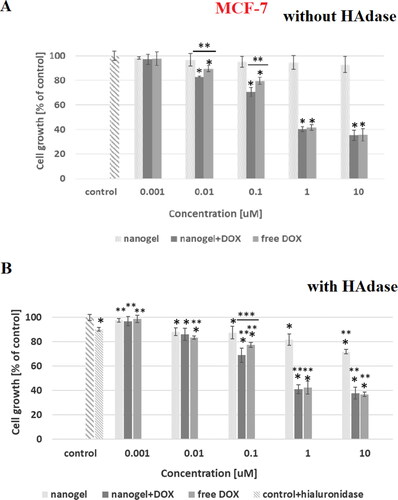
Figure 9. Results of MTT assay with A2780 cancer cell line and with and without HAdase after 72-h treatment with free DOX, DOX-loaded and drug-free NGs. One way ANOVA was used to test for statistical significance. Differences from control sample were marked with *, whereas ** marked differences between groups. The difference was considered significant for P values <05.
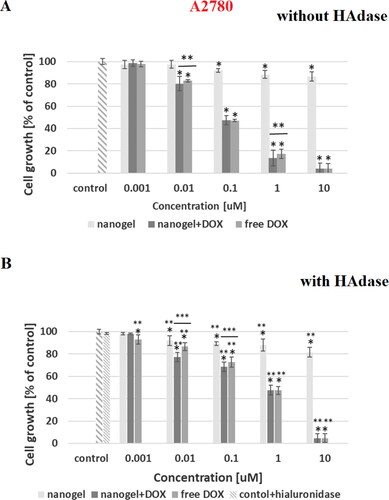
Figure 10. (a) Confocal images of cancer- (MCF-7) and health- (MCF-10A) cells obtained after 72-h incubation with DOX-loaded MEO2MA-OEGMA30%-MeHa-DEGDA NGs. Cell nuclei were stained with Hoechst fluorescent dye (blue color). Red color was emitted by DOX absorbed by cells. In case of cancer cells overlapping fluorescence signals of DOX and Hoechst dye were separated. (b) 3 D projections of MCF-7 and MCF-10A cell nuclei recorded after 72-h treatment with DOX-loaded MEO2MA-OEGMA30%-MeHa-DEGDA NGs. For each cell line separated fluorescent signals and merged signal are presented. Blue color marks cell nuclei stained with Hoechst dye. Red color indicates presence of DOX. (For interpretation of the references to color in this figure legend, the reader is referred to the web version of this article).
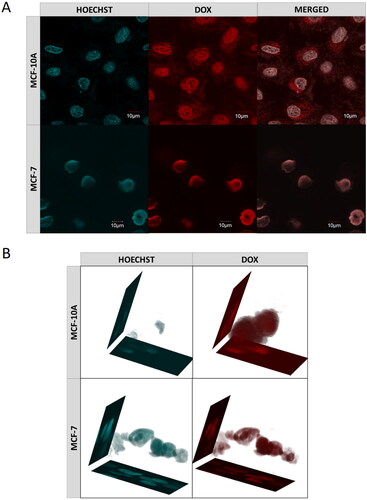
Table 4. IC50 values for MEO2MA-OEGMA30%-MeHa-DEGDA NGs with or without hyaluronidase enzyme for selected cell lines.
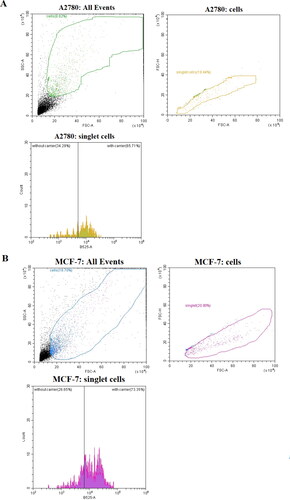
Figure 11. Representative flow cytometry traces characterizing A278 and MCF-7 cell lines after 24 h of incubation of NGs loaded with 0.005 µM DOX.