
Figures & data
Figure 1. Physical characterization of HIP complexes. A: Complexation efficiency of INS with different counterions at the indicated counterion to INS molar ratio, (B) partition coefficient of the HIP complex of INS. Values are presented as mean ± standard deviation (n = 3). CE, complexation efficiency; INS, insulin; SOS, sodium n-octadecyl sulfate; DOC, sodium docusate; SDC, sodium deoxycholate; OLE, sodium oleate; HIP, hydrophobic ion pairing.
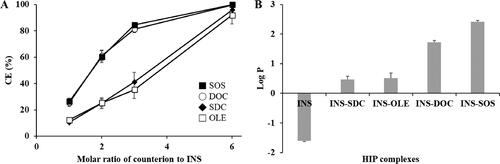
Figure 2. Characterization of INS–SOS complex. A: Scanning electron microscopy; (B) Fourier transform infrared spectroscopy; (C) differential scanning calorimetry thermograms. (a) INS; (b) SOS; (c) physical mixture of INS and SOS; (d) INS–SOS. Scale bar = 5 μm. INS, insulin; SOS, sodium n-octadecyl sulfate.
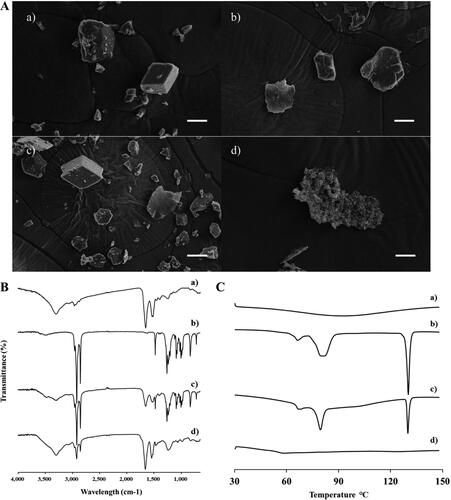
Figure 3. Dissociation behavior of the INS–SOS complex. A: Semi-log plots of the remaining INS–SOS complex in different concentrations of NaCl; (B) far-ultraviolet circular dichroism spectra of the INS solution, the dissociated INS, and INS–SOS. Values are presented as the mean ± standard deviation (n = 3). INS, insulin; SOS, sodium n-octadecyl sulfate.
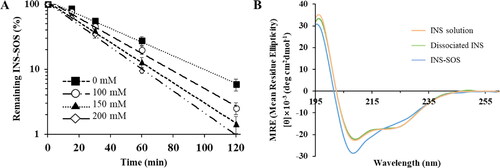
Table 1. Secondary structural compositions of the INS solution, dissociated INS, and INS-SOS.
Table 2. Solubility of INS-SOS in various lipid vehicles.
Figure 4. Pseudo-ternary phase diagram of Capmul MCM (oil), Labrasol (surfactant), and Tetraglycol (cosurfactant). Light gray, dark gray, and dashed areas indicate regions for the self-emulsifying drug delivery system, self-microemulsifying drug delivery system, and experimental domain, respectively.
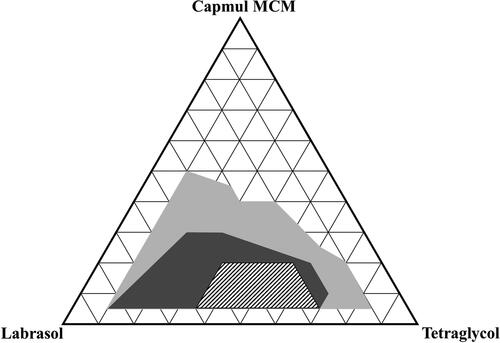
Figure 5. Experimental design and mathematically analyzed plots. A: Independent and response variables used in the D-optimal mixture design. (B) Three-dimensional response surface plots of each response variable. (C) Overlay plot of the optimized self-microemulsifying drug delivery system formulation. Values in contour lines represent the desirability; X1: Capmul MCM, X2: Labrasol, X3: Tetraglycol, Y1: droplet size, Y2: INS stability, Y3: INS leakage. INS, insulin.
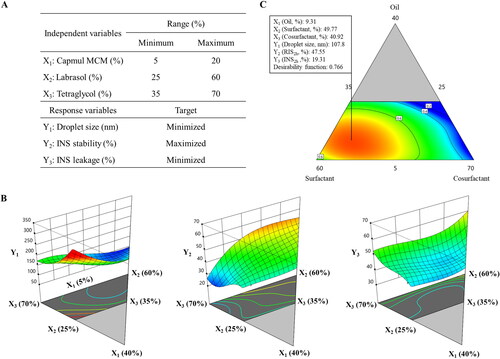
Table 3. Summary of the results of the statistical analysis and model equations for the measured responses.
Table 4. Analysis of variance for the quadratic model of the experimental responses.
Table 5. Predicted and experimental values for the optimized SMEDDS formulation.
Figure 6. Semi-log plots of remaining INS in different formulations in simulated gastric fluid (left) and simulated intestinal fluid (right). Values are presented as the mean ± standard deviation (n = 3). INS, insulin; SOS, sodium n-octadecyl sulfate; PM, physical mixture; SMEDDS, self-microemulsifying drug delivery system.
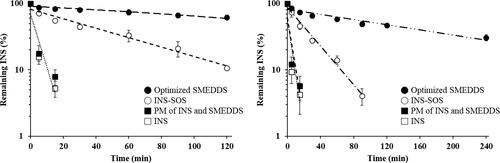
Figure 7. Release profiles of INS, INS–SOS, and the optimized SMEDDS in pH 1.2 medium with 1% Labrasol (left) and pH 6.8 medium (right). Values are presented as mean ± standard deviation (n = 3). Significantly different at p < .05 resulted from post hoc Tukey’s test: *versus INS; #versus INS and INS–SOS. INS, insulin; SOS, sodium n-octadecyl sulfate; SMEDDS, self-microemulsifying drug delivery system.
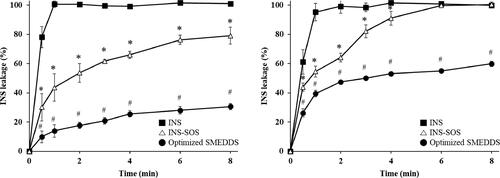
Figure 8. Blood glucose levels in diabetic rats after oral administration of the INS solution (50 IU/kg), INS–SOS solution (50 IU/kg), the optimized SMEDDS at 50 IU/kg (SMEDDS-50IU), and the optimized SMEDDS at 100 IU/kg (SMEDDS-100IU) and after SC administration of the INS solution (5 IU/kg). Values are presented as the mean ± standard deviation. INS, insulin; SOS, sodium n-octadecyl sulfate, SMEDDS, self-microemulsifying drug delivery system; SC, subcutaneous.
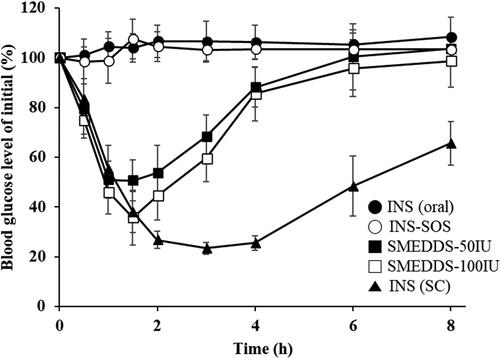
Table 6. Pharmacodynamic parameters of INS in a diabetic rat model following oral administration of INS (50 IU/kg), INS-SOS (50 IU/kg), the optimized SMEDDS at 50 IU/kg (SMEDDS-50IU), the optimized SMEDDS at 100 IU/kg (SMEDDS-100IU), and SC injection of INS solution (5 IU/kg).
Table 7. Analysis of variance results of pharmacodynamics parameters.