
Figures & data
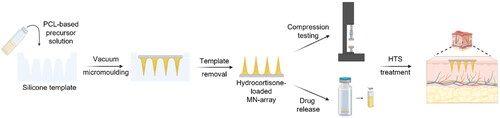
Table 1. List of the developed PCL-based MN precursor formulations utilized during molding.
Figure 1. Scheme representing the molding procedure. (a) represents the vacuum molding of the PCL 80 kg/mol-based MN arrays, while (b) shows the vacuum molding procedure for the AUP-PCL530-HA-based MN arrays. The illustration was prepared with Biorender.
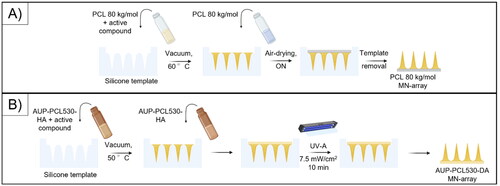
Table 2. List of the developed PCL-based MN precursor formulations utilized during characterization of the MN arrays, drug release studies and skin penetration evaluation. As not all types of arrays were evaluated in all studies, each subsection defines the utilized sample types throughout the manuscript utilizing the samples codes. The effectively encapsulated HC amounts were determined after the molding procedure.
Figure 2. Physico-chemical characterization of the developed AUP-PCL530-HA polymer. (A) shows the 1H-NMR spectrum of the product (the representative peaks are highlighted in yellow for the PCL backbone and in orange for the acrylate moieties) and of dimethyl terephthalate (DMT, internal standard, the representative peak is highlighted in blue). The acrylate content (2.17 mmol/g AUP-PCL530-HA) and molar mass (Mw = 2600 g/mol) of the product were evaluated based on the highlighted integrals and of EquationEqs. (1)–(2) and are in line with previous reports (O’Neil, Citation2001). (B) represents the swelling degree and gel fraction of the final product. The swelling degree implied limited swelling in chloroform, while the gel fraction suggested efficient photo-crosslinking.
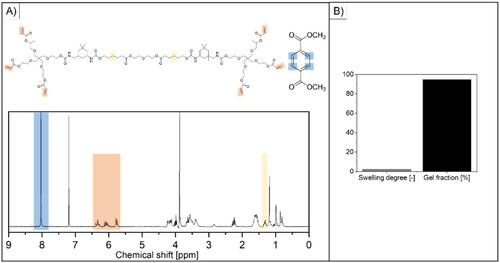
Figure 3. Swelling degree and gel fraction values of AUP-PCL530-HA and PCL 80 kg/mol in aqueous media. (a) suggests that no significant swelling of the PCL-based polymers could be observed in distilled water, which is in line with the hydrophobic nature of PCL. (B) shows a high (>90%) gel fraction for the PCL-based polymers in aqueous media. However, in case of the AUP-PCL530-HA, the leaching out of additives applied during production (O’Neil, Citation2001) could be observed through the gel fraction decrease.
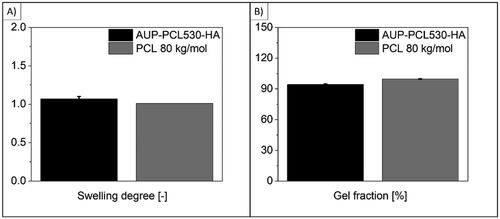
Table 3. TGA data of the PCL-based polymer compositions applied for the development of the MN arrays.
Table 4. Thermal properties of the PCL-based polymer compositions and additives applied for the development of the MN arrays determined via DSC.
Figure 4. Mechanical evaluation of the PCL-based MN arrays exploiting compression testing. Both the AUP-PCL530-HA and PCL 80 kg/mol MN arrays could withstand the 7 N compression force limit, which is considered the hand-pressing insertion force. The AUP-PCL530-HA-based MN arrays showed excellent compression resistance up to 15-20 N load, whereas the PCL 80 kg/mol-based MN arrays could withstand 8–10 N load at 0.5 mm/min compression speed. The presence of HC and/or brij®35 did not show a pronounced effect on the mechanical properties of the MN arrays.

Figure 5. Illustration of the extended drug release profile of hydrocortisone from the different PCL-based MN arrays. (a) shows the cumulative HC release from the control, HC, brij®35 and HC + brij®35 containing MN arrays. The composition of the MN arrays can be found in . A significant release increase could be observed upon utilizing brij®35 as release enhancer in combination with HC compared to the HC-containing samples for both AUP-PCL530-HA and PCL 80 kg/mol MN arrays, while the control and brij®35 containing samples did not show any HC release. (B) shows a substantial increase in the cumulative HC release upon the utilization of AUP-PCL530-HA as polymer matrix contrary to the PCL 80 kg/mol due to the lack of crystallinity in the AUP matrix both for HC and for HC + brij®35 containing MN arrays. The graphs also indicate that while the PCL 80 kg/mol-based MN arrays could provide a sustained HC release for 7 days, upon utilization of AUP-PCL530-HA, the release profile could be extended up to 21 days. (C) shows the cumulative release of HC in percentage as a function of HC load on the left and in milligrams (mg) on the right over 21 days of release. The application of brij®35 did not have a significantly increasing effect on the HC release (p > .05).
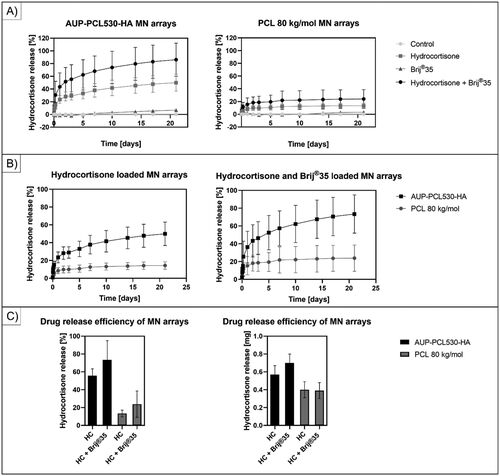
Figure 6. Cumulative release of HC for 10 days. (a) shows the release profile and cumulative release of HC at 50 mg/500 mg polymer load, 125 mg/500 mg polymer load and 250 mg/500 mg polymer load. (B) shows the release profile and cumulative release of HC at 50 mg/500 mg polymer load, 125 mg/500 mg polymer load and 250 mg/500 mg polymer load in the presence of 50 µl/500 mg polymer brij®35 content. The results suggested a decrease in the drug release efficiency upon increasing the drug load in the AUP-PCL530-HA MN arrays.
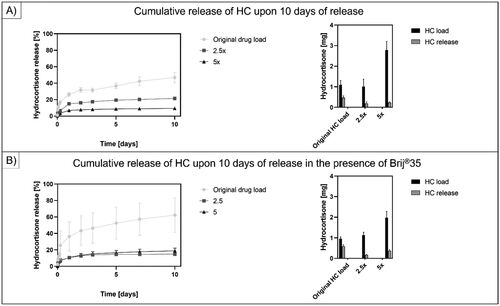
Figure 7. Scanning electron microscopy (SEM) micrographs of AUP-PCL530-HA and PCL 80 kg/mol MN arrays. The top row represents the control, the Middle row the HC loaded and the bottom row the HC + brij®35 loaded MN arrays in side- and top view subsequent to the drug release studies. The incorporation of HC in the MN arrays led to an increased surface roughness of the MNs, due to the partial phase separation between the HC and the PCLs, which induced the crystallization of HC within the MNs. The incorporation of HC + brij®35 in the MN arrays led to an even higher surface roughness of the MNs due to the phase separation occurring between the HC + brij®35 and the PCLs, which was more pronounced in case of the PCL 80 kg/mol arrays. The scale bars refer to the following lengths: green – 200 µm, red – 100 µm, white – 50 µm, blue – 10 µm.
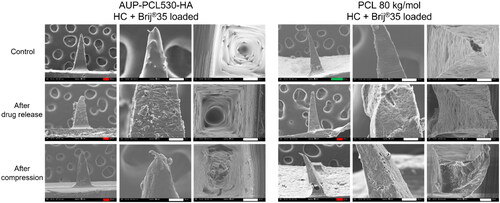
Figure 8. Scanning electron microscopy (SEM) micrographs of AUP-PCL530-HA and PCL 80 kg/mol MN arrays. The top row represents the HC loaded MN arrays after molding, the second row after drug release, the third row after compression testing, and the bottom row following ex vivo skin insertion. It should be noted that the phase separation of HC was more pronounced in the AUP-PCL530-HA arrays. Following drug release, the crystals have dissolved from the needles. Moreover, the AUP-PCL530-HA arrays stayed intact subsequent to compression and skin insertion, in contrast with the PCL 80 kg/mol arrays, which permanently deteriorated upon exerting mechanical stress. The scale bars refer to the following lengths: green – 200 µm, red – 100 µm, white – 50 µm, blue – 10 µm.
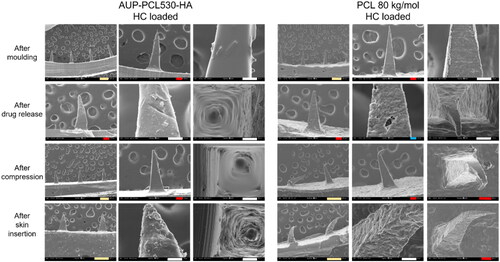
Figure 9. HE-stained 3 µm thick histological slice showing the skin piercing capability of the drug-embedded AUP-PCL530-HA MN. Black arrows show regular indentations of the epidermal layer and blue arrows show the pyramidical shaped penetration cavity through the epidermal layer toward the deeper dermal layer. Both are sequelae of microneedle application. The scale bar represents 200 µm. Magnification is 10x.
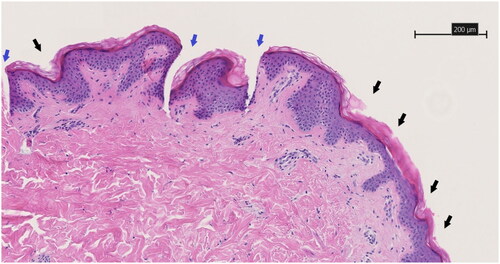
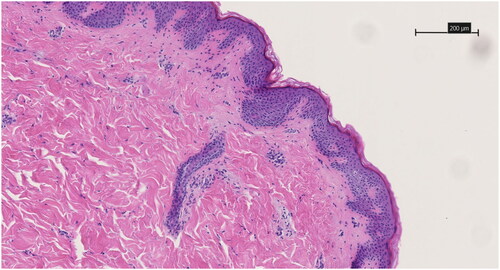
Figure 10. HE-stained 3 µm thick histological slice of the control specimen that did not receive microneedle treatment. The scale bar represents 200 µm. Magnification is 10x.
Supplemental Material
Download MS Word (1.4 MB)Data availability statement
The data gained during the preparation of the manuscript are available upon request from the corresponding author, Sandra Van Vlierberghe.