
Figures & data
Scheme 1. Schematic illustration of a novel liposomal co-delivery system with ginsenoside Rh2 for enhancing anti-glioma activity and attenuate systemic toxicity (all details on the picture were created by the author Hui Ao).
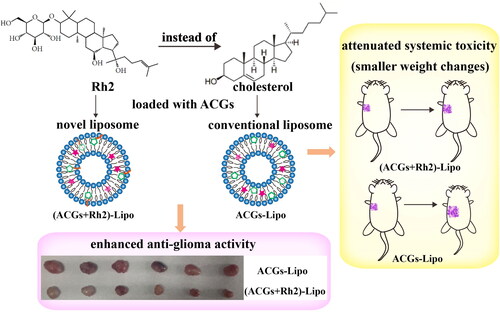
Table 1. Optimization of the preparation method of ACGs-Lipo (n = 3, mean ± SD).
Figure 1. Preparation of liposomes. The optimal preparation process of ACGs-Lipo (A) and (ACGs + Rh2)-Lipo (B). (C) The appearance of (ACGs + Rh2)-Lipo at different concentrations of phospholipid (from left to right: 8 mg/mL, 10 mg/mL, 12 mg/mL, 15 mg/mL, and 18 mg/mL). All details on A and B were created by the author Hui Ao.
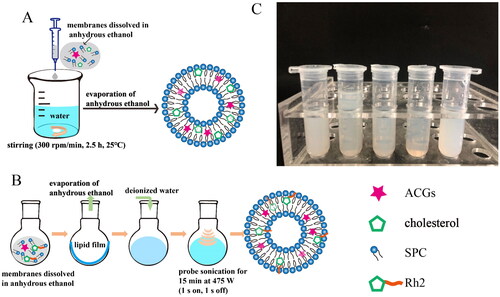
Table 3. Optimization of the concentration of phospholipid in the preparation of (ACGs + Rh2)-Lipo (n = 3, mean ± SD).
Table 2. Optimization of the preparation method of (ACGs + Rh2)-Lipo (n = 3, mean ± SD).
Figure 2. Characterization of liposomes. (A) Particle size distributions of ACGs-Lipo and (ACGs + Rh2)-Lipo. The morphology of ACGs-Lipo (B), and (ACGs + Rh2)-Lipo (C). Particle size change curves of ACGs-Lipo (D) and (ACGs + Rh2)-Lipo (E) in physiological media (n = 3, mean ± SD).
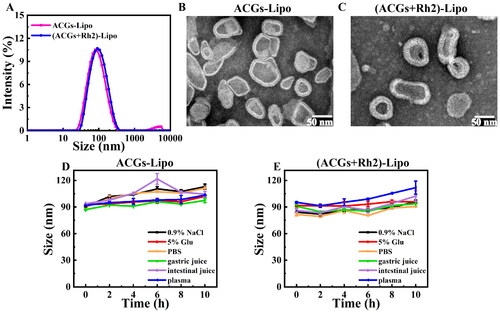
Figure 3. The in vitro release profiles of ACGs-Lipo and (ACGs + Rh2)-Lipo (n = 3, mean ± SD).
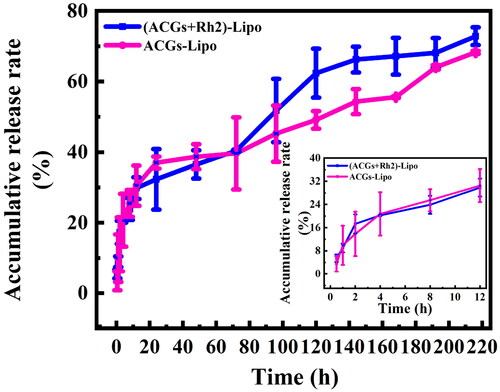
Figure 4. The in vitro cytotoxicity of free Rh2 (A), Rh2-Lipo (B), free ACGs (C), and ACGs-Lipo and (ACGs + Rh2)-Lipo (D) against U87 MG cells (n = 3, mean ± SD).
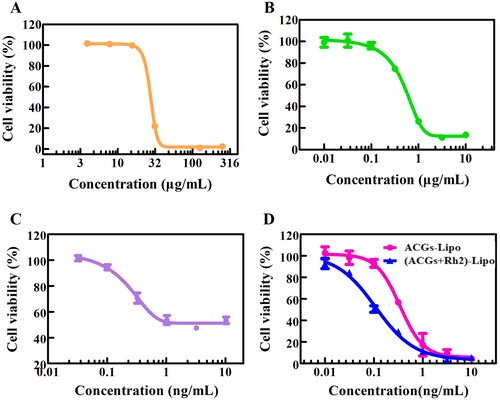
Table 4. The IC50 of free drug and liposomes against U87 MG cells (n = 3, mean ± SD).
Figure 5. In vivo antitumor efficacy in U87 MG tumor‑bearing mice. (A) Schematic diagram of the in vivo antitumor study procedure. (B) The change curve of the mouse tumor volume. (C) The change curve of the mouse body weight. (D) The optical photos of tumors at the end of the experiment. (E) The liver index of the mouse in each group. (F) The spleen index of the mouse in each group. Data represent the mean ± SD (n = 6).
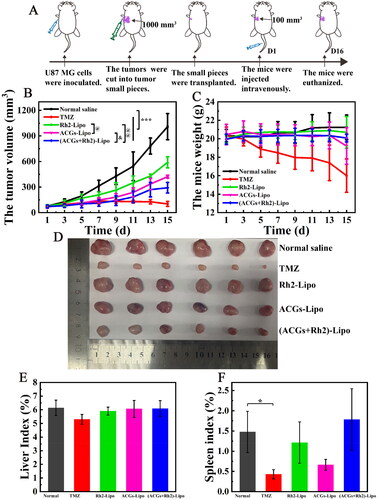
Table 5. The anti-glioma activity and changes in body weight of mice in each group (n = 6, mean ± SD).
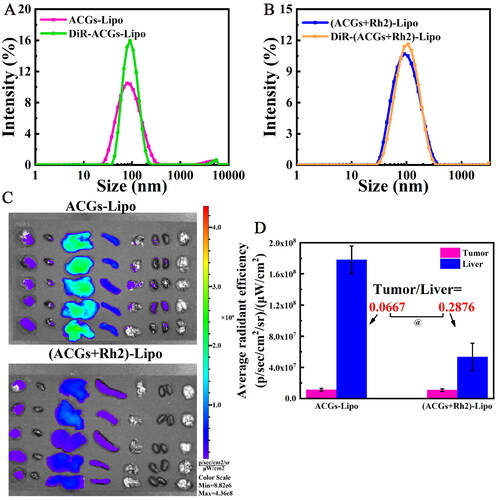
Figure 6. In vivo biodistribution in U87 MG tumor‑bearing mice. Comparison of particle size distribution after DiR-labeling of ACGs-Lipo (A) and (ACGs + Rh2)-Lipo (B). (C) The ex vivo distribution of DiR-ACGs-Lipo and DiR-(ACGs + Rh2)-Lipo in U87 MG tumor-bearing mice 24 hours after administration (n = 5). (D) The fluorescence intensity in tumor and liver of ACGs-Lipo and (ACGs + Rh2)-Lipo and their RTTI (n = 5, mean ± SD).
Supplemental Material
Download MS Word (595.8 KB)Data availability statement
The data supporting this work are accessible upon reasonable request from the corresponding author.