
Figures & data
Figure 1. A–B. Injection procedure with VTT-T mock tissue (A) and BCM tissue (B) and dye liquid (PBS colored with bromophenol blue). The backflow was collected with filter paper immediately after needle removal. 1–0 Overall view of the BCM model.1–1 Injection in the BCM model.1–2 Backflow following needle removal in the BCM model.1–3 collection of backflow with filter paper in the BCM model. 1B. 1–0 Overall view of the VTT and VTT-T models. 1–1 Injection in the VTT and VTT-T models. 1-2 Backflow following needle removal in the VTT and VTT-T models. B1-3 Collection of backflow with filter paper in the VTT and VTT-T models.
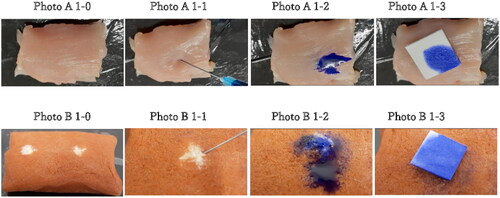
Figure 2. A–B. Effect of GP35 (A) and GP75 (B) microparticle concentration dependence on backflow reduction in the VTT model, VTT-T model and BCM. **: p value ≤ 0.01, ***: P value ≤ .001, ****: p value ≤ .0001. The experiment was performed with 27 G needles.
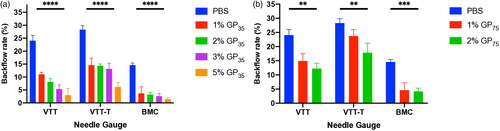
Figure 3. Effect of HG on backflow reduction in the VTT model, VTT-T and BCM model. *: p value ≤ .05. **: p value ≤ .01, ***: p value ≤ .001. The experiment was performed with 27 G needles.
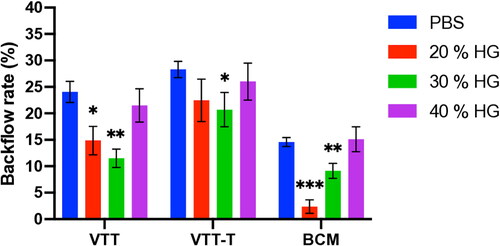
Figure 4. A–C. Effect of HG low (a), medium (B), and high (C) molecular weight on backflow reduction in the BCM model. **: p value ≤ .01, ***: p value ≤ .001. The experiment was performed with 27 G needles.
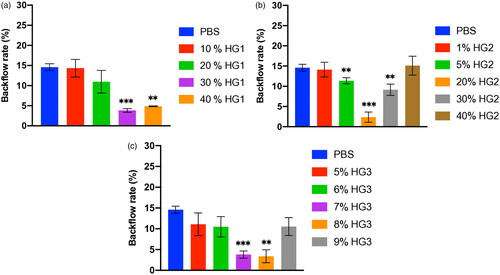
Figure 5. A–B. Effect of the needle gauge on backflow reduction in GP35 concentration-dependent injection in VTT (a), VTT-T (B) tissues. *: p value ≤ .05, **: p value ≤ .01, ****: p value ≤ .0001. C. Effect of the needle gauge on backflow reduction in GP75 and HG in BCM tissue. **: p value ≤ .01, ***: p value ≤ .001. The experiment was performed with 27 G needles.
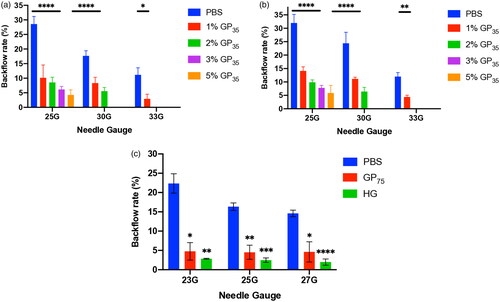
Figure 6. A-C. Effect of the injection volume on backflow reduction in GP35 and HG injection in VTT (a), VTT-T (B) and BCM (C) tissues. *: p value ≤ .05, **: p value ≤ .01, ***: p value ≤ .001, ****: P value ≤ .0001.
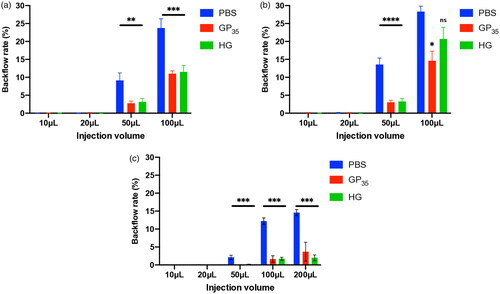
Figure 7. Relationship between gelatin viscosity and backflow reduction. Gelatin solutions HG1, HG2, and HG3 of different molecular weights were injected 3 mm deep into the BCM tissue with 27 G needles.
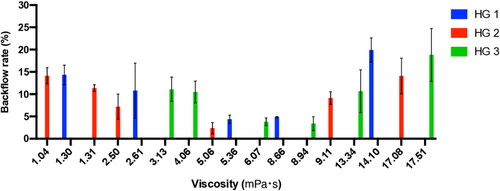
Table 1. Sample characteristics.
Data availability statement
The data presented in this study are available upon request to the corresponding authors.