
Figures & data
Figure 1. Apparent solubility of TQM in the aqueous solution of soluplus®, kolliphor® P188 and, kolliphor® P407 at various concentrations (5–25 mg/mL). Data presented as mean ± S.D. (n=3).
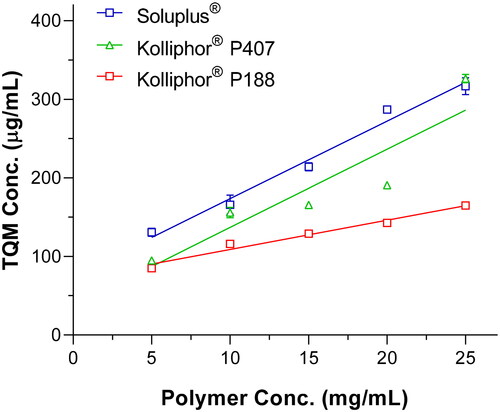
Table 1. Apparent solubility data of binary complexes of TQM with different polymers.
Table 2. Dissolution properties of TQM samples.
Figure 2. Crystallinity assessment of TQM samples using (A) XRPD and (B) DSC. (I) Crystalline TQM, (II) SMSD-TQM/RVD, and (III) SMSD-TQM/FD.
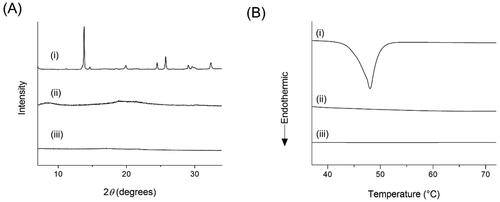
Figure 3. Microscopic images observed by polarized light microscope (A) and scanning electron microscope (B). (I) Crystalline TQM, (II) SMSD-TQM/RVD, and (III) SMSD-TQM/FD. Each black and white bar represents 100 μm and 50 μm, respectively.
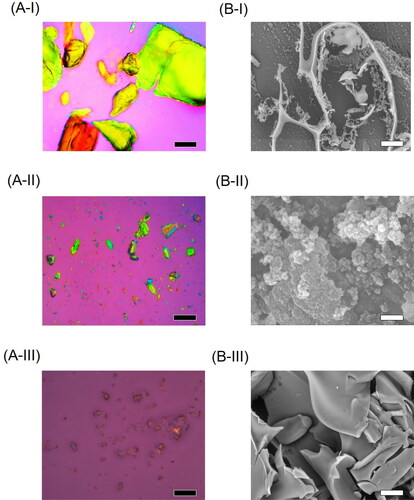
Figure 4. Micelle forming potency of TQM samples dispersed in water. (A) Micelle size distribution of SMSD-TQM spread in distilled water as determined by DLS analysis: the red line represents the particle size distribution of SMSD-TQM/FD; and the green line represents the particle size distribution of SMSD-TQM/RVD. (B) TEM image of SMSD-TQM dispersed in distilled water. Bar represents 500 nm.
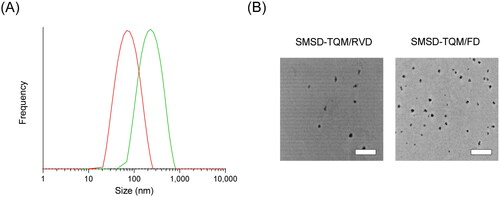
Figure 5. Dissolution tests of TQM samples in water. ○, crystalline TQM; △, SMSD-TQM/RVD; ▽, PM of TQM and soluplus®, and ◇, SMSD-TQM/FD. Data represent the mean ± S.D. of 3 experiments.
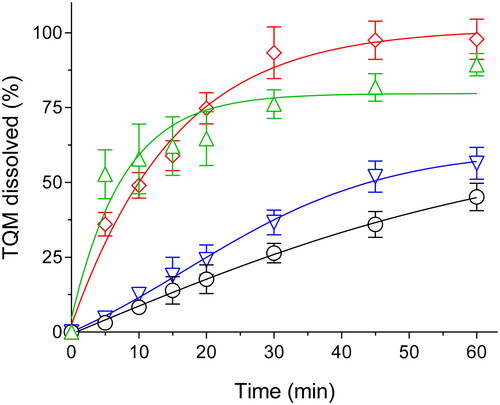
Figure 6. Drug-polymer interaction studies of TQM samples using FT-IR. Baseline-corrected and normalized IR data of TQM samples in the spectral wavenumber region from (A) 4,000–600 cm−1 and (B) 1,800–1,300 cm−1. (I) SMSD-TQM/FD, (II) SMSD-TQM/RVD (III) Soluplus®, and (IV) crystalline TQM.
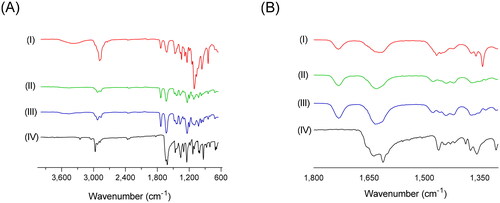
Figure 7. Plasma concentration-time profile of TQM after oral administration of TQM samples in rats. ○, crystalline TQM (10 mg/kg, p.o.), □, SMSD-TQM/RVD (5 mg-TQM/kg, p.o.), and △, SMSD-TQM/FD (5 mg-TQM/kg, p.o.). data represent mean ± S.E. of 6 experiments.
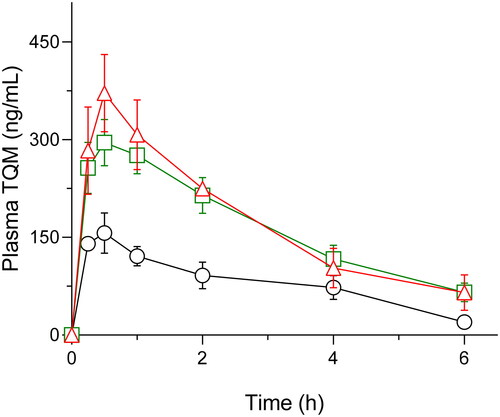
Table 3. Pharmacokinetic parameters of TQM samples following oral administration to rats.
Figure 8. Nephrotoxic potential in a rat nephropathy model induced by cisplatin (6 mg/kg, ip). (A) plasma creatinine, (B) BUN, (C) NO, (D) SOD, (E) GSH, and (F) AOPP levels in rats with orally dosed crystalline TQM and SMSD-TQM (10 mg/kg, 4 days). **, P < 0.01; ***, P < 0.001 with respect to cisplatin-treated rats; ##, P < 0.01; ###, P < 0.001, TQM vs. SMSD-TQM. Data represent mean ± S.E. of 4 experiments.
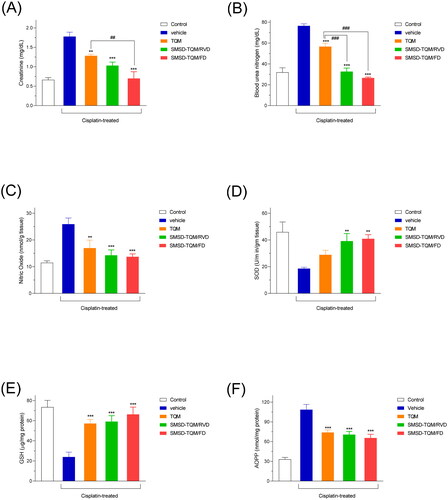
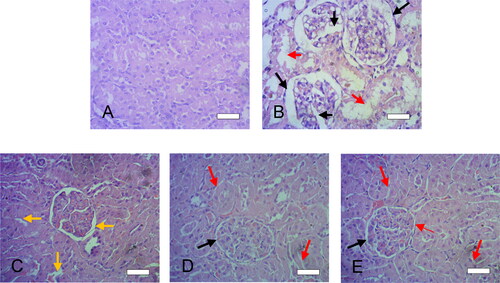
Figure 9. Histological features of liver sections after cisplatin challenge with or without oral administration of crystalline TQM (10 mg/kg, p.o.) or SMSD-TQM (10 mg-TQM/kg, p.o.). (A) Rats treated with saline, (B) cisplatin-treated rats, (C) cisplatin-treated rats with crystalline TQM, (D) cisplatin-treated rats with SMSD-TQM/RVD and (E) cisplatin-treated rats with SMSD-TQM/FD. Each bar represents 50 µm.
Supplemental Material
Download MS Word (17.5 KB)Data availability statement
Upon a reasonable request, the corresponding author will provide access to the data supporting this study.