Figures & data
Table 1. Linker and Polymer Chemistry. Variable linker chemistries were examined though all chemistries used targeted lysine (more correctly, epsilon amino acid) residues. The efficiency of binding and the efficacy of the induced immunocamouflage were examined via flow cytometry and mixed lymphocyte reactions. The BTCmPEG 5000 and BTCmPEG 20000 were further analyzed to determine the effect of polymer size on the induced immunocamouflage
Figure 1 Covalent grafting of mPEG to splenocyte membranes significantly attenuates allorecognition of H-2 disparate cells. Shown are the proliferation responses of one-way MLR in which the responder cells have been derivatized with CmPEG 5000, BTCmPEG 5000, or BTCmPEG 20000. Insert: Photomicrographs of unstimulated splenocytes show the small rounded morphology typical of resting lymphocytes (1). In contrast, allostimulation of control (unmodified) splenocytes results in multiple foci of proliferating alloresponsive cells (2). However, as can be seen, mPEG-modified (0.6 mM) splenocytes fail to proliferate and remain morphologically unactivated (3). The data presented represented the co-culturing of 5.12 × 10⁶ mPEG-modified Balb/c splenocytes with 5.12 × 10⁶ irradiated C57Bl/6 splenocytes. The results shown represent the mean ± standard deviation of triplicate samples from a minimum of 4 independent experiments. Photomicrographs are representative samples.
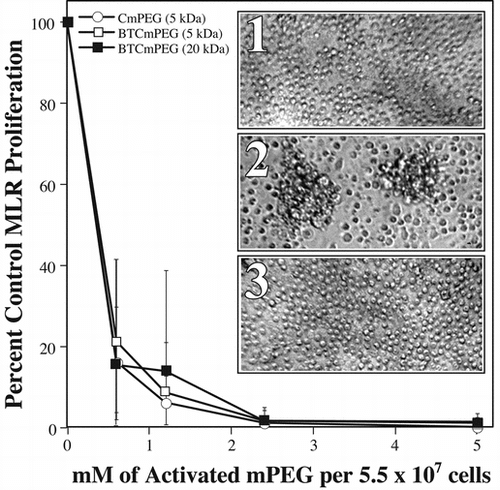
Table 2. In the absence of allogeneic stimulation cell viability is unaffected by the covalent grafting of mPEG to membrane surfaces when using CmPEG 5000, BTCmPEG 5000, or BTCmPEG 20000. In contrast, TmPEG 5000 was found to exert a potent toxic effect on murine splenocytes. This toxicity was also noted on human peripheral blood mononuclear cells (data not shown). Viability was determined by flow cytometric analysis of propidium iodide exclusion. Shown are the average percentages from two experiments
Figure 2 The proliferation potential of mPEG modified splenocytes is unaffected as demonstrated by direct mitogen stimulation. Shown are the mitogen proliferation responses of cells derivatized with CmPEG 5000 (A), BTCmPEG 5000 (B), or BTCmPEG 20000 (C). Mitogen stimulation was done using a combination of PMA (50 ng/ml) and Ionomycin (2 µg/ml). Shown are the mean ± standard deviation of triplicate samples from two independent experiments.
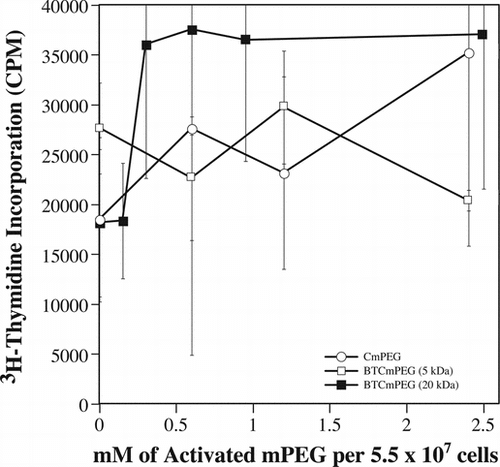
Table 3. In the presence of allogeneic stimulation cell viability was significantly decreased in a time and mPEG dose dependent manner following the covalent grafting of CmPEG 5000, BTCmPEG 5000, or BTCmPEG 20000. Because of the toxicity associated with TmPEG in the absence of allogeneic stimulation, viability was not included below but approached zero in all cases.Viability was determined by flow cytometric analysis of propidium iodide exclusion. Shown are the average percentages from two experiments
Figure 3 Apoptosis is preferentially induced in mPEG-modified cells upon challenge with allogeneic stimulator cells. In contrast, in the absence of allostimulation, control (lane A) and mPEG-modified (lane B) murine splenocytes demonstrate comparable viability (Table ) and DNA laddering profiles as shown by ethidium bromide staining and densitometry. Shown is a representative ethidium bromide stained agarose gel showing the DNA laddering patterns after 48 incubation in the absence (−) and presence (+) of allogeneic stimulators. The mPEG-modified cells were derivatized in the presence of 1.2 mM CmPEG 5000. Also shown are densitometric analysis of the agarose gel. Area analysis (a) of the lower banding areas are given as is the average proliferation index (PI) of the MLR as determined by Figure . PI = (CPM Exp. MLR/CPM Control MLR) × 100.
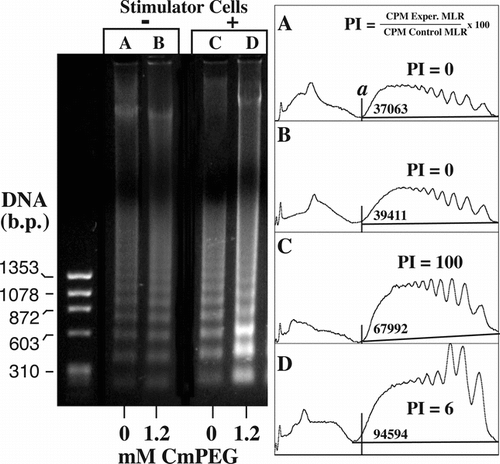
Figure 4 mPEG grafting effectively immunocamouflages membrane proteins as demonstrated by the loss of antibody recognition of the murine T Cell Receptor (TCR) and CD4 molecule. Shown are representative flow cytometric dot plots of control and CmPEG 5000 (2.4 mM) derivatized murine splenocytes.
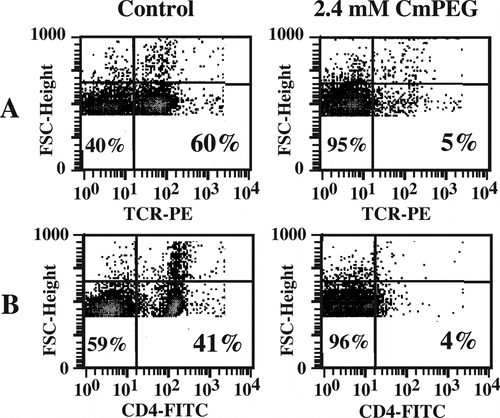
Figure 5 Differential effects of linker chemistry and polymer length on the immunocamouflage of membrane proteins. Shown are the percent positive cells for CD11a, MHC Class II, CD4 and the T cell receptor (TCR) following derivatization with CmPEG 5000, BTCmPEG 5000, and BTCmPEG 20000. The values shown are normalized to the unmodified control population.
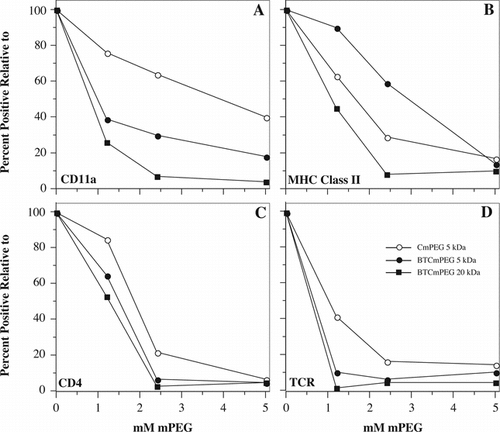
Figure 6 Mechanism of immunocamouflage. As shown, rigid linear molecules have a small radius of gyration (Rg) and fail to effectively camouflage (shaded area, a and b) cell surface proteins and carbohydrates (“antigens”). In contrast, the linear, but highly flexible, mPEG polymer yields a large zone of steric occlusion (shaded areas c and d). As noted, the immunocamouflaged area effectively covers membrane antigens. The size of the area of protection is dependent up on the length (L) of the polymer and its resultant Rg.
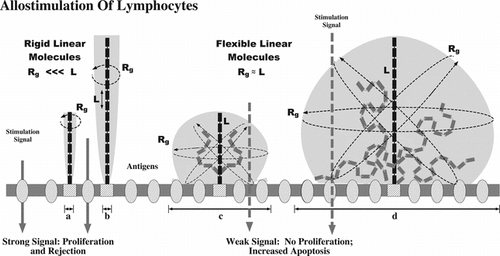
Table 4. The covalent grafting of mPEG to membrane proteins results in the global camouflage of multiple proteins crucial for effective allorecognition of foreign tissue. Values shown are “Percent Positive Cells” relative to the unmodified control (= 100). The results given are the mean of a minimum of 3 separate experiments
