665
Views
34
CrossRef citations to date
0
Altmetric
Original

Acellular Invertebrate Hemoglobins as Model Therapeutic Oxygen Carriers: Unique Redox Potentials

, , , &
Pages 53-67 | Published online: 24 Aug 2009

Figures & data

Figure 1 Isothermal unfolding of invertebrate acellular hemoglobins in the presence of urea at 37°C, 50 mM Hepes, 100 mM KCl, pH 7.0. Astarte Hb (▪), Cardita Hb (♦), Lumbricus Hb (•), and Arenicola Hb (▴).
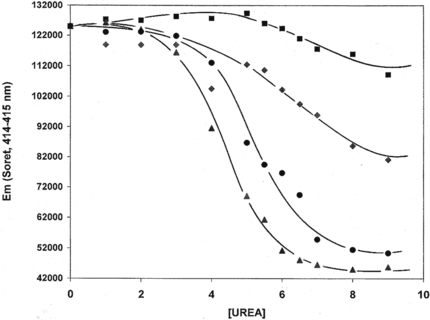
Figure 1 Isothermal unfolding of invertebrate acellular hemoglobins in the presence of urea at 37°C, 50 mM Hepes, 100 mM KCl, pH 7.0. Astarte Hb (▪), Cardita Hb (♦), Lumbricus Hb (•), and Arenicola Hb (▴).

Table 1. Formal redox potentials of hemoglobin-base oxygen carriers by thin-layer spectroelectrochemistry (T = 20°C)

Figure 2 Autoxidaion of Lumbricus Hb (♦), Arenicola Hb (▪), and Cardita Hb (○) at 37°C. Decreases in the Abs576/Abs540 ratio reflect the conversion of oxyHb to metHb. All solutions contain 50 mM Hepes, 100 mM KCl, pH 7.0.

Figure 2 Autoxidaion of Lumbricus Hb (♦), Arenicola Hb (▪), and Cardita Hb (○) at 37°C. Decreases in the Abs576/Abs540 ratio reflect the conversion of oxyHb to metHb. All solutions contain 50 mM Hepes, 100 mM KCl, pH 7.0.

Figure 3 Comparison of oxidation of Arenicola Hb (○), Lumbricus Hb (▪), and HbA (♦) by Fe+3-ATP complex at 37°C. The HbA data (T = 25°C) is from Harrington and Hicks (14).

Figure 3 Comparison of oxidation of Arenicola Hb (○), Lumbricus Hb (▪), and HbA (♦) by Fe+3-ATP complex at 37°C. The HbA data (T = 25°C) is from Harrington and Hicks (14).

Figure 4 Absorbance spectra of Arenicola hemoglobin at differing potentials in the absence of oxygen (+ 400 mV to − 600 mV). The fully oxidized ArHb is indicated by λmax = 402 nm and the fully reduced ArHb is indicated by λmax = 425 nm. All potentials were measured against Ag/AgCl reference electrode at 20°C.
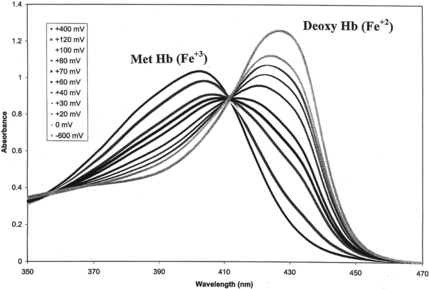
Figure 4 Absorbance spectra of Arenicola hemoglobin at differing potentials in the absence of oxygen (+ 400 mV to − 600 mV). The fully oxidized ArHb is indicated by λmax = 402 nm and the fully reduced ArHb is indicated by λmax = 425 nm. All potentials were measured against Ag/AgCl reference electrode at 20°C.

Table 2. Reduction (heme-Fe+3 → heme-Fe+2) of terrestrial and marine acellular Hbs by ascorbic acid and glutathione at T = 20°C, pH 7.0

Reprints and Corporate Permissions

Please note: Selecting permissions does not provide access to the full text of the article, please see our help page How do I view content?

To request a reprint or corporate permissions for this article, please click on the relevant link below:

Academic Permissions

Please note: Selecting permissions does not provide access to the full text of the article, please see our help page How do I view content?

Obtain permissions instantly via Rightslink by clicking on the button below:

If you are unable to obtain permissions via Rightslink, please complete and submit this Permissions form. For more information, please visit our Permissions help page.