Figures & data
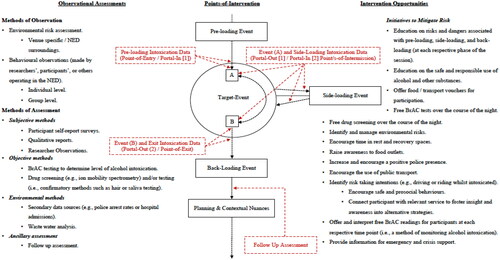
Figure 1. This model provides an updated visual representation of a ‘session’ at the event-level.
Note. The colored dotted line represents the trajectory a person makes as they transition through the phases of pre-loading, target-event, side-loadingFootnote5, and back-loadingFootnote6. It is to be noted that people may not participate in all phases of the session (e.g., a person may avoid ‘loading’ practices altogether and choose only to enter the target-event). The squares labeled ‘A’ and ‘B’ inside the target-event denote venues inside the NED. The doubled arrow connecting these venues reflects a persons’ movements around the NED.
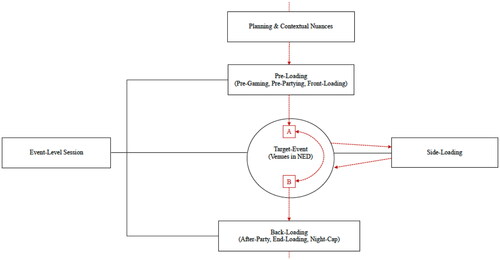
Table 1. Inclusion and exclusion criteria across all studies.
Table 2. A summary table demonstrating the key features of the nine studies included.
Figure 2. A visual representation of the portal design applied to the broader event-level session.
Note. Portal-in (1) reflects the best point in time for the accurate collection of pre-loading data. However, any reference to the act of pre-loading should be discerned from portal-in (2).
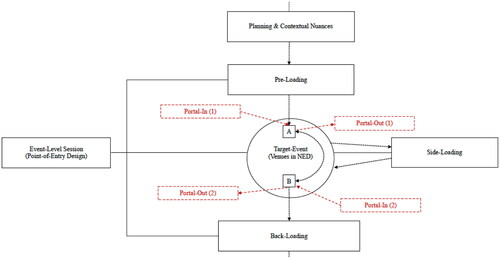
Figure 3. A visual representation the point-of-entry design as applied to the broader event-level session.
Note. This approach captures pre-loading estimates as people transition from the pre-loading event and into the target-event. We have also specified various points-of-intermission and the point-of-exit as a methodological note for future reference.
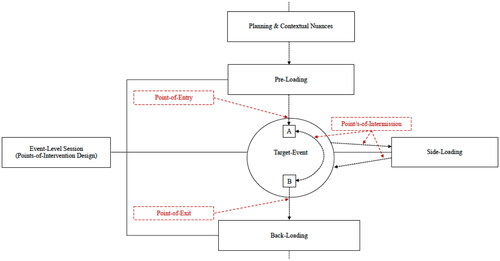
Figure 4. A visual representation the point/s-of-intervention design as comprised within our model of an event-level session.
Note. In this figure we have labeled specific reference points where ‘loading’ and ‘event’ specific estimates of intoxication are most reliably captured. Additionally, we have also mapped on to this model points/s-of-intervention for future researchers to consider implementing into their designs to alleviate the burden of harm people experience in this context.