
Figures & data
Table 1. Descriptive information and independent sample t-test output of gender differences in alcohol consumption and the six indicators of mental well-being.
Table 2. Mean scores of the mental well-being variables for abstainers, moderate drinkers, and excessive drinkers, separately for females and males.
Figure 1. AUDIT-c and depression. The GAM model was adopted. ggPlot visualizations of the significant LM and GAM in the relationship between AUDIT-c score and depression for females. The dotted line indicates the LM, full line indicates the GAM. The size of the dots refers to the number of observations per data point.
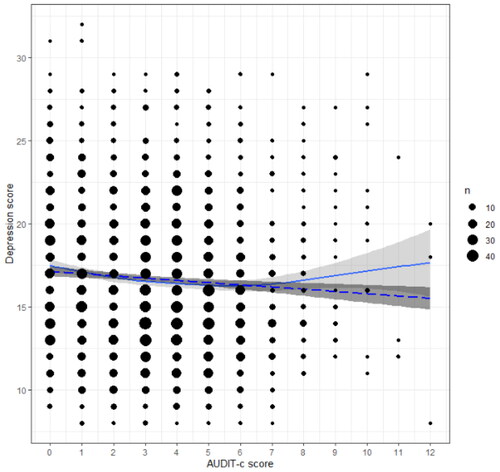
Figure 2. AUDIT-c and anxiety. LM model was adopted. ggPlot visualizations of the significant LM and GAM in the relationship between AUDIT-c score and anxiety for females. The dotted line indicates the LM, full line indicates the GAM. The size of the dots refers to the number of observations per data point.
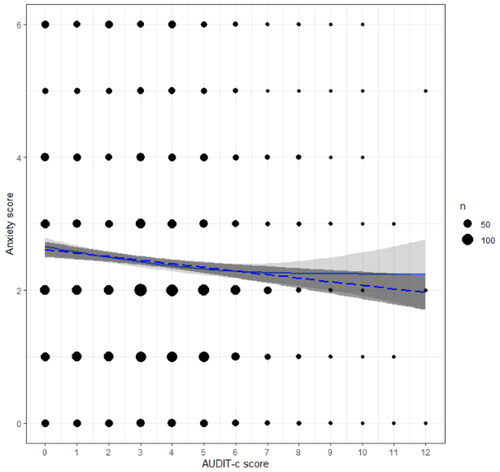
Figure 3. AUDIT-c and perceived stress. The GAM model was adopted. ggPlot visualizations of the significant GAM in the relationship between AUDIT-c score and perceived stress for females. The full line indicates the GAM. The size of the dots refers to the number of observations per data point.
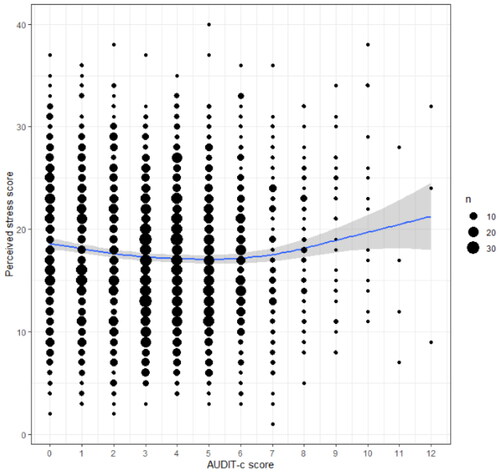
Figure 4. AUDIT-c and life satisfaction. LM model was adopted. ggPlot visualizations of the significant LM and GAM in the relationship between AUDIT-c score and life satisfactionfor females. The dotted line indicates the LM, full line indicates the GAM. The size of the dots refers to the number of observations per data point.
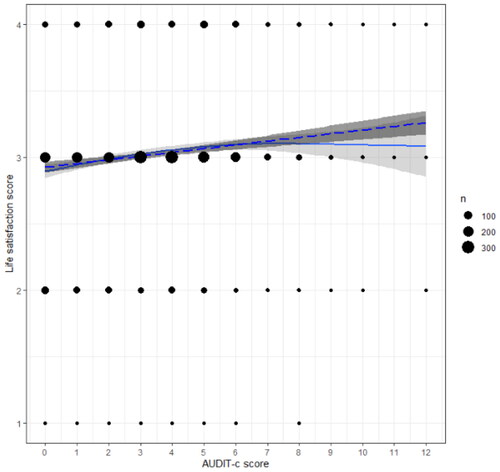
Figure 5. AUDIT-c and happiness. The GAM model was adopted. ggPlot visualizations of the significant LM and GAM in the relationship between AUDIT-c score and happiness for females. The dotted line indicates the LM, full line indicates the GAM. The size of the dots refers to the number of observations per data point.
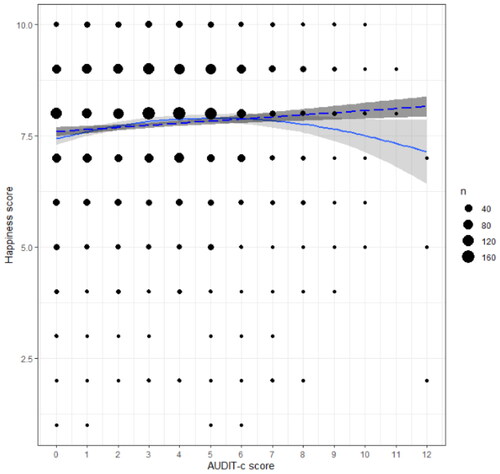
Figure 6. AUDIT-c and mental health. LM model was adopted. ggPlot visualizations of the significant LM and GAM in the relationship between AUDIT-c score and self-rated mental health score for females. The dotted line indicates the LM, full line indicates the GAM. The size of the dots refers to the number of observations per data point.
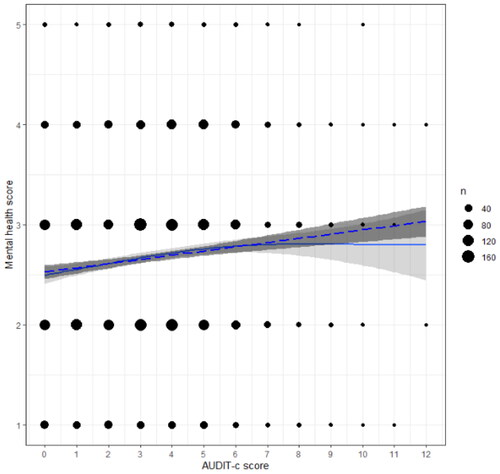
Table 3. Results of the linear and curvilinear models for the relationship between alcohol consumption (AUDIT-c) and each of the indicators of mental well-being for females and males separately.
Supplemental Tables.docx
Download MS Word (21.6 KB)Supplemental Methods.docx
Download MS Word (22.2 KB)Data availability
The dataset in this manuscript is part of a larger project (the Healthy Student Life project, https://www.ru.nl/bsi/research/group-pages/healthy-student-life/.). The dataset and scripts generated and analyzed for the current study are available from the corresponding author upon reasonable request.