Figures & data
TABLE 1. Methods of Dosing Rodent Lower Respiratory Tract with Particles
TABLE 2. Physicochemical Characteristics which influence Toxicity of CNTs and CNFs
FIGURE 1 a. MWCNT aerosols at a research facility.
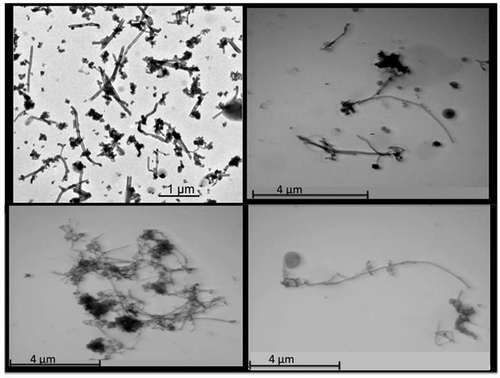
FIGURE 1 b. MWCNT aerosols collected at a research facility.
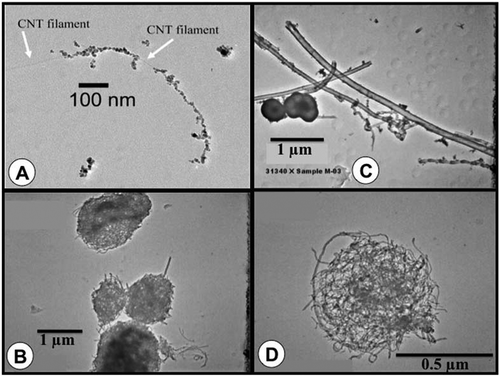
FIGURE 2. CNF aerosols collected on impactor stages during thermal treatment.
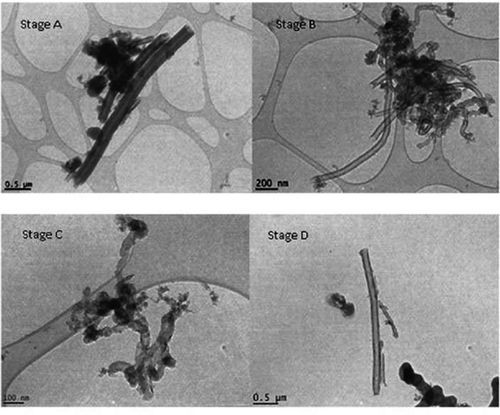
FIGURE 3. Dosimetric Extrapolation of Inhaled Particles from Rats to Humans.
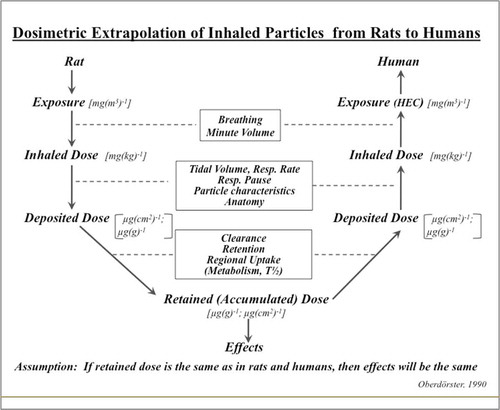
FIGURE 4. Exposure-Response and Dose-Response.
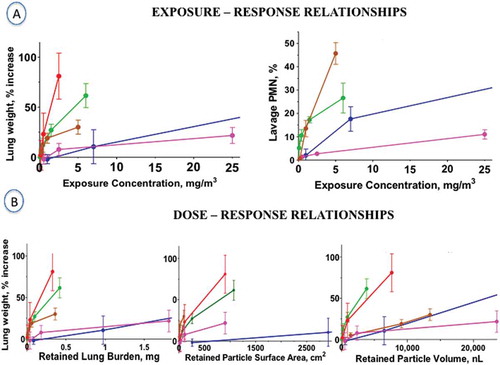
FIGURE 5. MWCNT aerosol size distribution in rodent inhalation study.
FIGURE 6. MWCNT aerosols collected in rodent inhalation study.
FIGURE 7. MWCNT aerosols collected in rodent inhalation study.
TABLE 3. 90-Day Rat Inhalation Studies with MWCNT and CNF, Exposure-Dose-Response Comparison
TABLE 4. Surface Areas of Respiratory Tract Regions at FRC
TABLE 5. Acute to Chronic Inhalation Exposures of Rodents to CNT/CNF for Toxicity Testing. (rat as preferred species; 4–6 hrs/day, 5 d/wk; whole-body)
TABLE 6. Percent Deposition of Inhaled Particles of Unit Density (ρ = 1 g/cm3) in Extrathoracic, Tracheobronchial, and Alveolar Regions of Rodents
FIGURE 9. MWCNT aerosol size distribution in rodent inhalation study.
FIGURE B-1. CNT/CNF thoracic fractions for humans and rats.
TABLE 7. Instruments and techniques for characterizing nano-aerosol exposure (modified from ISO TR12885)
TABLE 8. Recommendation for exposure characterization of sampled and airborne CNT/CNF (modified from Oberdörster et al., 2005)
FIGURE A-1. CNT/CNF inhalability for humans and rats.
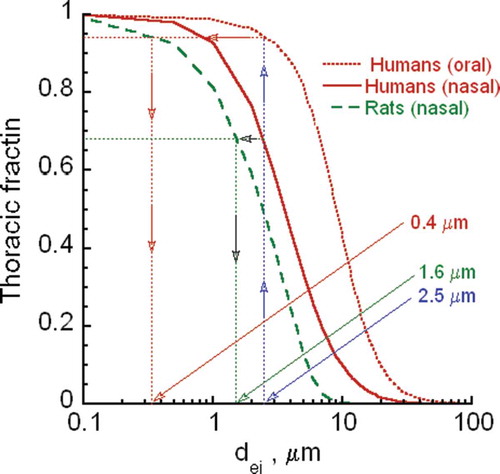
FIGURE B-2. Human to rat ratios for equal thoracic fractions.
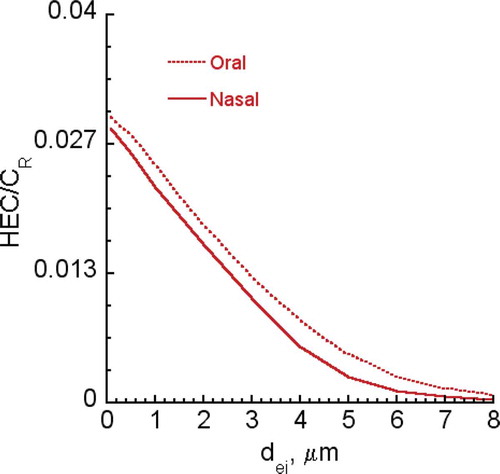
FIGURE B-3. CNT/CNF respiratory fractions for humans at different aspect ratios.
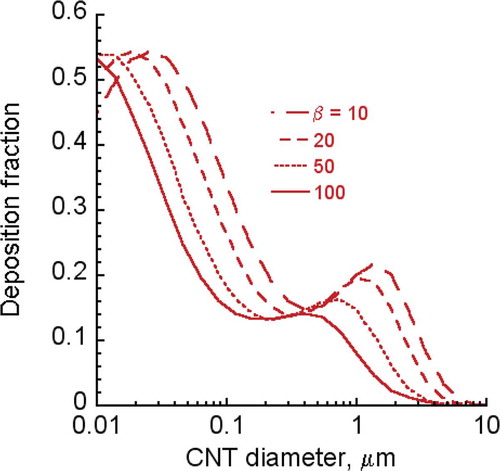
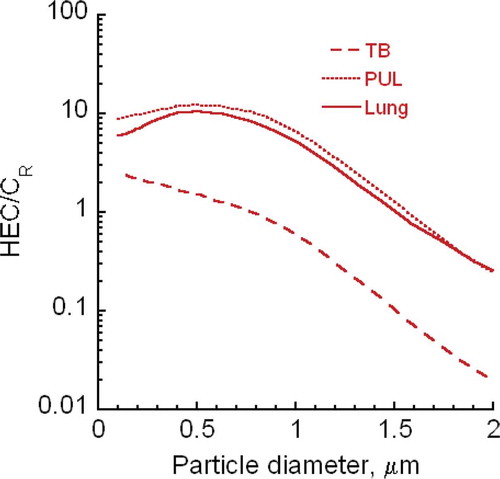
FIGURE B-4. HEC/CR ratios for CNT/CNF (100 nm—2 μm diameter) at aspect ratio of 10.