Figures & data
Table 1. Locations and characteristics of 6 bus stops in the present study
Table 2. PM2.5 personal exposure of one smoker and three nonsmokers sitting on bus stop benches during smoking period (μg/m3)
Figure 1.Scale drawing showing positions of four to five persons at bus stops along the two California arterial highways.
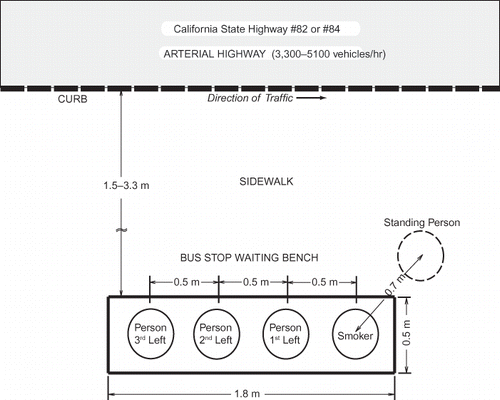
Figure 2.Time series of breathing-zone PM2.5 exposures of one smoker and three nonsmokers measured during the 1-hr visit to Bus Stop E on El Camino Real and Cambridge Avenue.
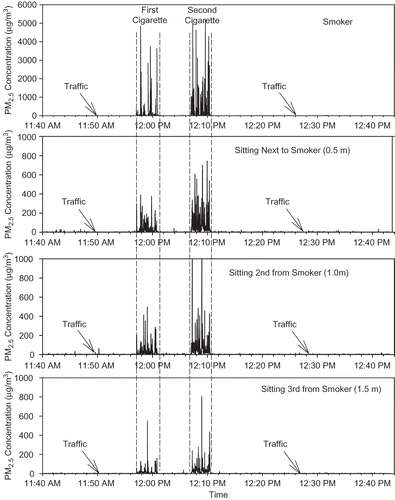
Figure 3.Frequency distributions of PM2.5 breathing-zone exposures of four persons sitting on the bench at Bus Stop E along with a standing person showing the first cigarette (top) and second cigarette (bottom).
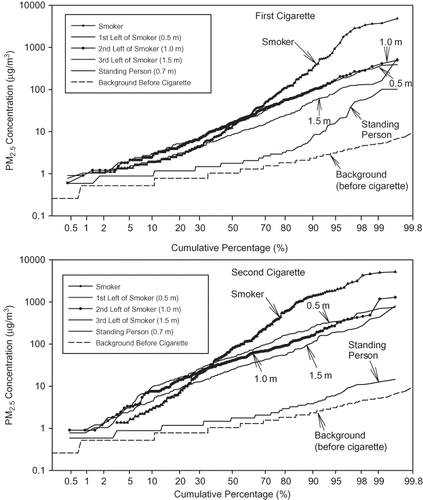
Table 3. Ninety-fifth percentile PM2.5 exposures in μg/m3 for 13 cigarettes smoked at six bus stops
Figure 4.Frequency distributions of PM2.5 breathing-zone exposures of four persons on the bench at Bus Stop B for the first cigarette (top) and second cigarette (bottom) showing the relative straightness of distributions after adjustment by subtracting a small shift parameter from all exposures (1.3 μg/m3).
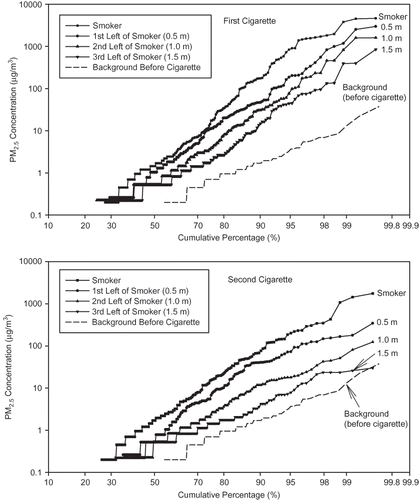
Table 4. Adjusted PM2.5 exposures for two smoking periods at Bus Stop B, with arithmetic and geometric parameters of lognormal model estimated by linear regression
Table 5. Ultrafine particle (UFP) concentrations measured by the person sitting next to the smoker for 13 cigarettes during seven bus stop smoking experimentsFootnote a
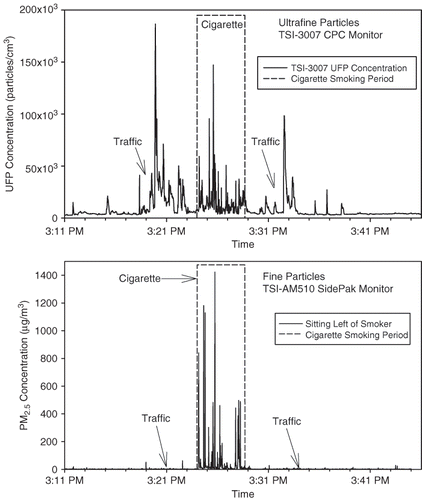
Figure 5.Time series of ultrafine particle concentration (top) and PM2.5 exposure (bottom) for the person sitting closest (0.5 m) to the smoker during the 1-hr visit to Bus Stop E.
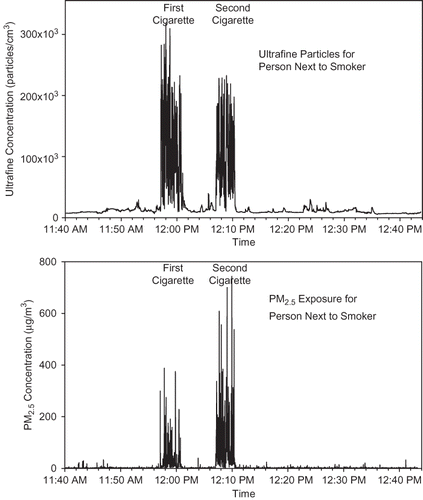
Figure 6.Time series of ultrafine particle concentration (top) and PM2.5 exposure (bottom) for the person sitting closest (0.5 m) to the smoker during the half-hour visit to Bus Stop F.