Figures & data
Table 1. Incidence values associated with changes to ozone as a result of two regional GHG policies.
Table 2. Incidence values associated with changes to PM2.5 as a result of two regional GHG policies.
Figure 1. Time series of total U.S. carbon emissions from 2010 to 2030 for Business as Usual (no policy; black line), and two subnational carbon cap scenarios applied to the Northeast only: Clean Energy Standard (green dashed line) and Cap and Trade (blue dashed line). Please note range of x-axis.
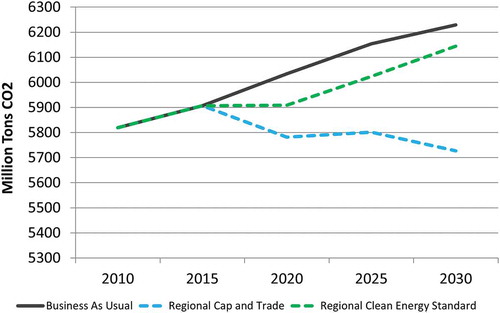
Figure 2. Year 2030 annual change of five common air pollutants (in million tons) due to Clean Energy Standard and Cap and Trade policy scenarios, summed for the Northeast states, and all other states.
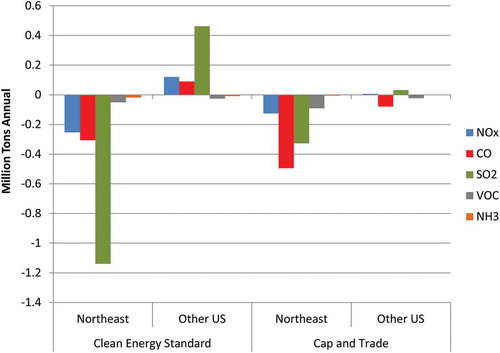
Figure 3. Spatial maps showing the modeled changes in ozone (ppb; left column) and PM2.5 (µg/m3; right column) as a result of three policy scenarios: Clean Energy Standard (top row) and economy-wide Cap and Trade (bottom row). States covered by policy are shown in gray. Ozone results are averaged daily maximum 8 hr from May to September (the “ozone season”), whereas PM2.5 results are an annual average.
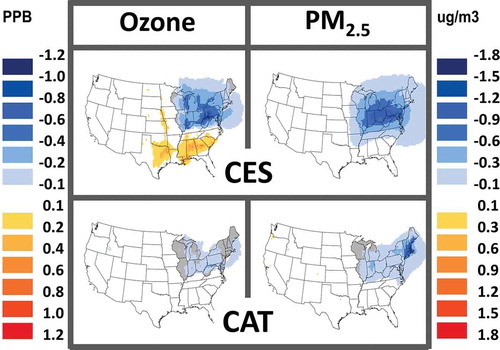
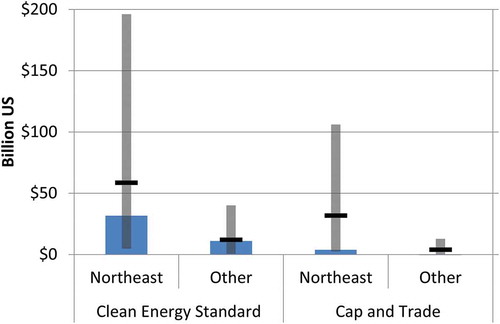
Figure 4. Economic costs (blue bar) of the regional carbon policies presented with human health co-benefits (black line) associated with each scenario with 95% confidence intervals (gray line) associated with concentration-response functions and valuation. Values are in 2006 U.S. dollars and as a 2030 annual total.